Operation & Maintenance Best Practices Guidelines (Version 6.0)
Do you prefer the guidelines as a pdf file?
Download PDFAre you interested in downloading a specific chapter?
Search the reports?
SearchKey Performance Indicators
This chapter will focus on KPIs used to assess the performance of solar PV power plants. It will cover three main categories of KPIs: Solar PV power plant KPIs, which are quantitative measures of the plant’s performance; O&M service provider KPIs, which include both quantitative and qualitative indicators to evaluate the service quality provided by the O&M provider; and Solar PV power plant/O&M service provider KPIs, which assess both the plant’s performance and the quality of O&M services together. These KPIs offer asset owners a comprehensive overview of the operational effectiveness of both the plant, and its maintenance services.
This section deals with Key Performance Indicators (KPIs), which provide the Asset Owner with a quick reference on the performance of the solar PV power plant. The KPIs in this chapter are divided into the following categories:
• Solar PV power plant KPIs, which directly reflect the performance of a solar PV power plant. They are quantitative indicators
• O&M service provider KPIs, which reflect the performance of the service provided by the O&M service provider. O&M service provider KPIs are both quantitative and qualitative indicators
• Solar PV power plant/O&M service provider KPIs, which reflect solar PV power plant performance and O&M service quality at the same time
The O&M service provider (or the Technical Asset Manager) is generally responsible for the calculation of the KPIs and reporting to the Asset Owner.
It is important to underline that the O&M service provider is not responsible for providing contractual guarantees for all the KPIs listed in this chapter. When there are warranties in place it is strongly advised that the party liable for the warranties is not the only one calculating the KPIs.

10.1. Solar PV power plant data
Solar PV power plant data can be split into three groups:
1. Raw data measurements: data obtained directly from the solar PV power plant and used for performance calculation
The following is a list of raw data measurements that can be used to calculate KPIs:
• AC Apparent Power produced (kVA)
• AC Active Power (kW)
• AC Energy produced (kWh)
• AC Energy metered (kWh)
• Reactive power (kVAR)
• Irradiance5 (reference for the plant or the sub-plants) (W/m2)
• Air and module temperature (Celsius degrees)
• Alarm, status code and duration
• Outages, unavailability events
This is a basic list, and it is non-exhaustive.
1. Solar PV power plant KPIs: using the raw data from the solar PV power plant to give a more balanced overview of its operation
2. Solar PV power plant healthiness KPI: generating data and information from physical inspections of a PV power plant that can serve as potential precursors for performance and/ or safety related deteriorations
Raw data measurements and Solar PV power plant KPI are ex post data, whereas Solar Power plant healthiness KPI are ex ante providing useful information and clues for future occurrences.
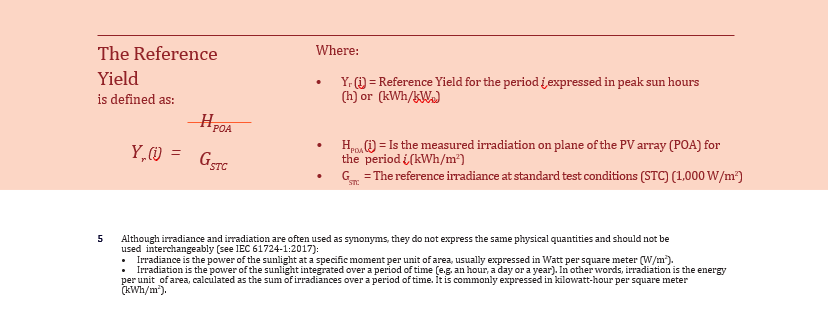
Reference Yield
The Reference Yield Yr represents the energy obtainable under standard conditions, with no losses, over a certain period i. It is useful to compare the Reference Yield with the final system yield (See Section Performance Ratio).
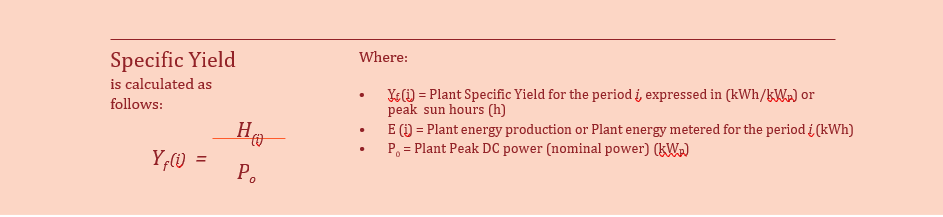
Specific Yield
Specific Yield, also called final yield, Yf is the measure of the total energy generated, normalised per kWp installed, over a certain period i.
This measurement integrates plant output over a chosen time frame, and since it normalises to nominal power, comparison of the production of plants with different nominal power or even different technologies (e.g. solar PV, wind, biomass etc) is possible. For example, the Specific Yield of a solar PV power plant can be compared against the Specific Yield of a wind plant for the purposes of making an investment decision. Moreover, the Specific Yield of a 5 MWp ground mounted solar PV power plant can be compared directly to that of a 1 MWp double tracker power plant, for example.
Calculating Specific Yield on the inverter level also allows a direct comparison between inverters that may have different AC/DC conversion rates or different nominal powers. Moreover, by checking inverter level Specific Yield within a plant, it is possible to detect whether an inverter is performing worse than others.
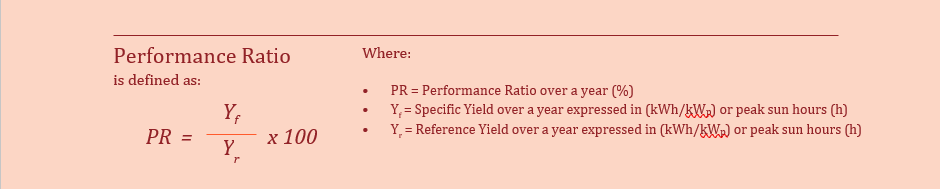
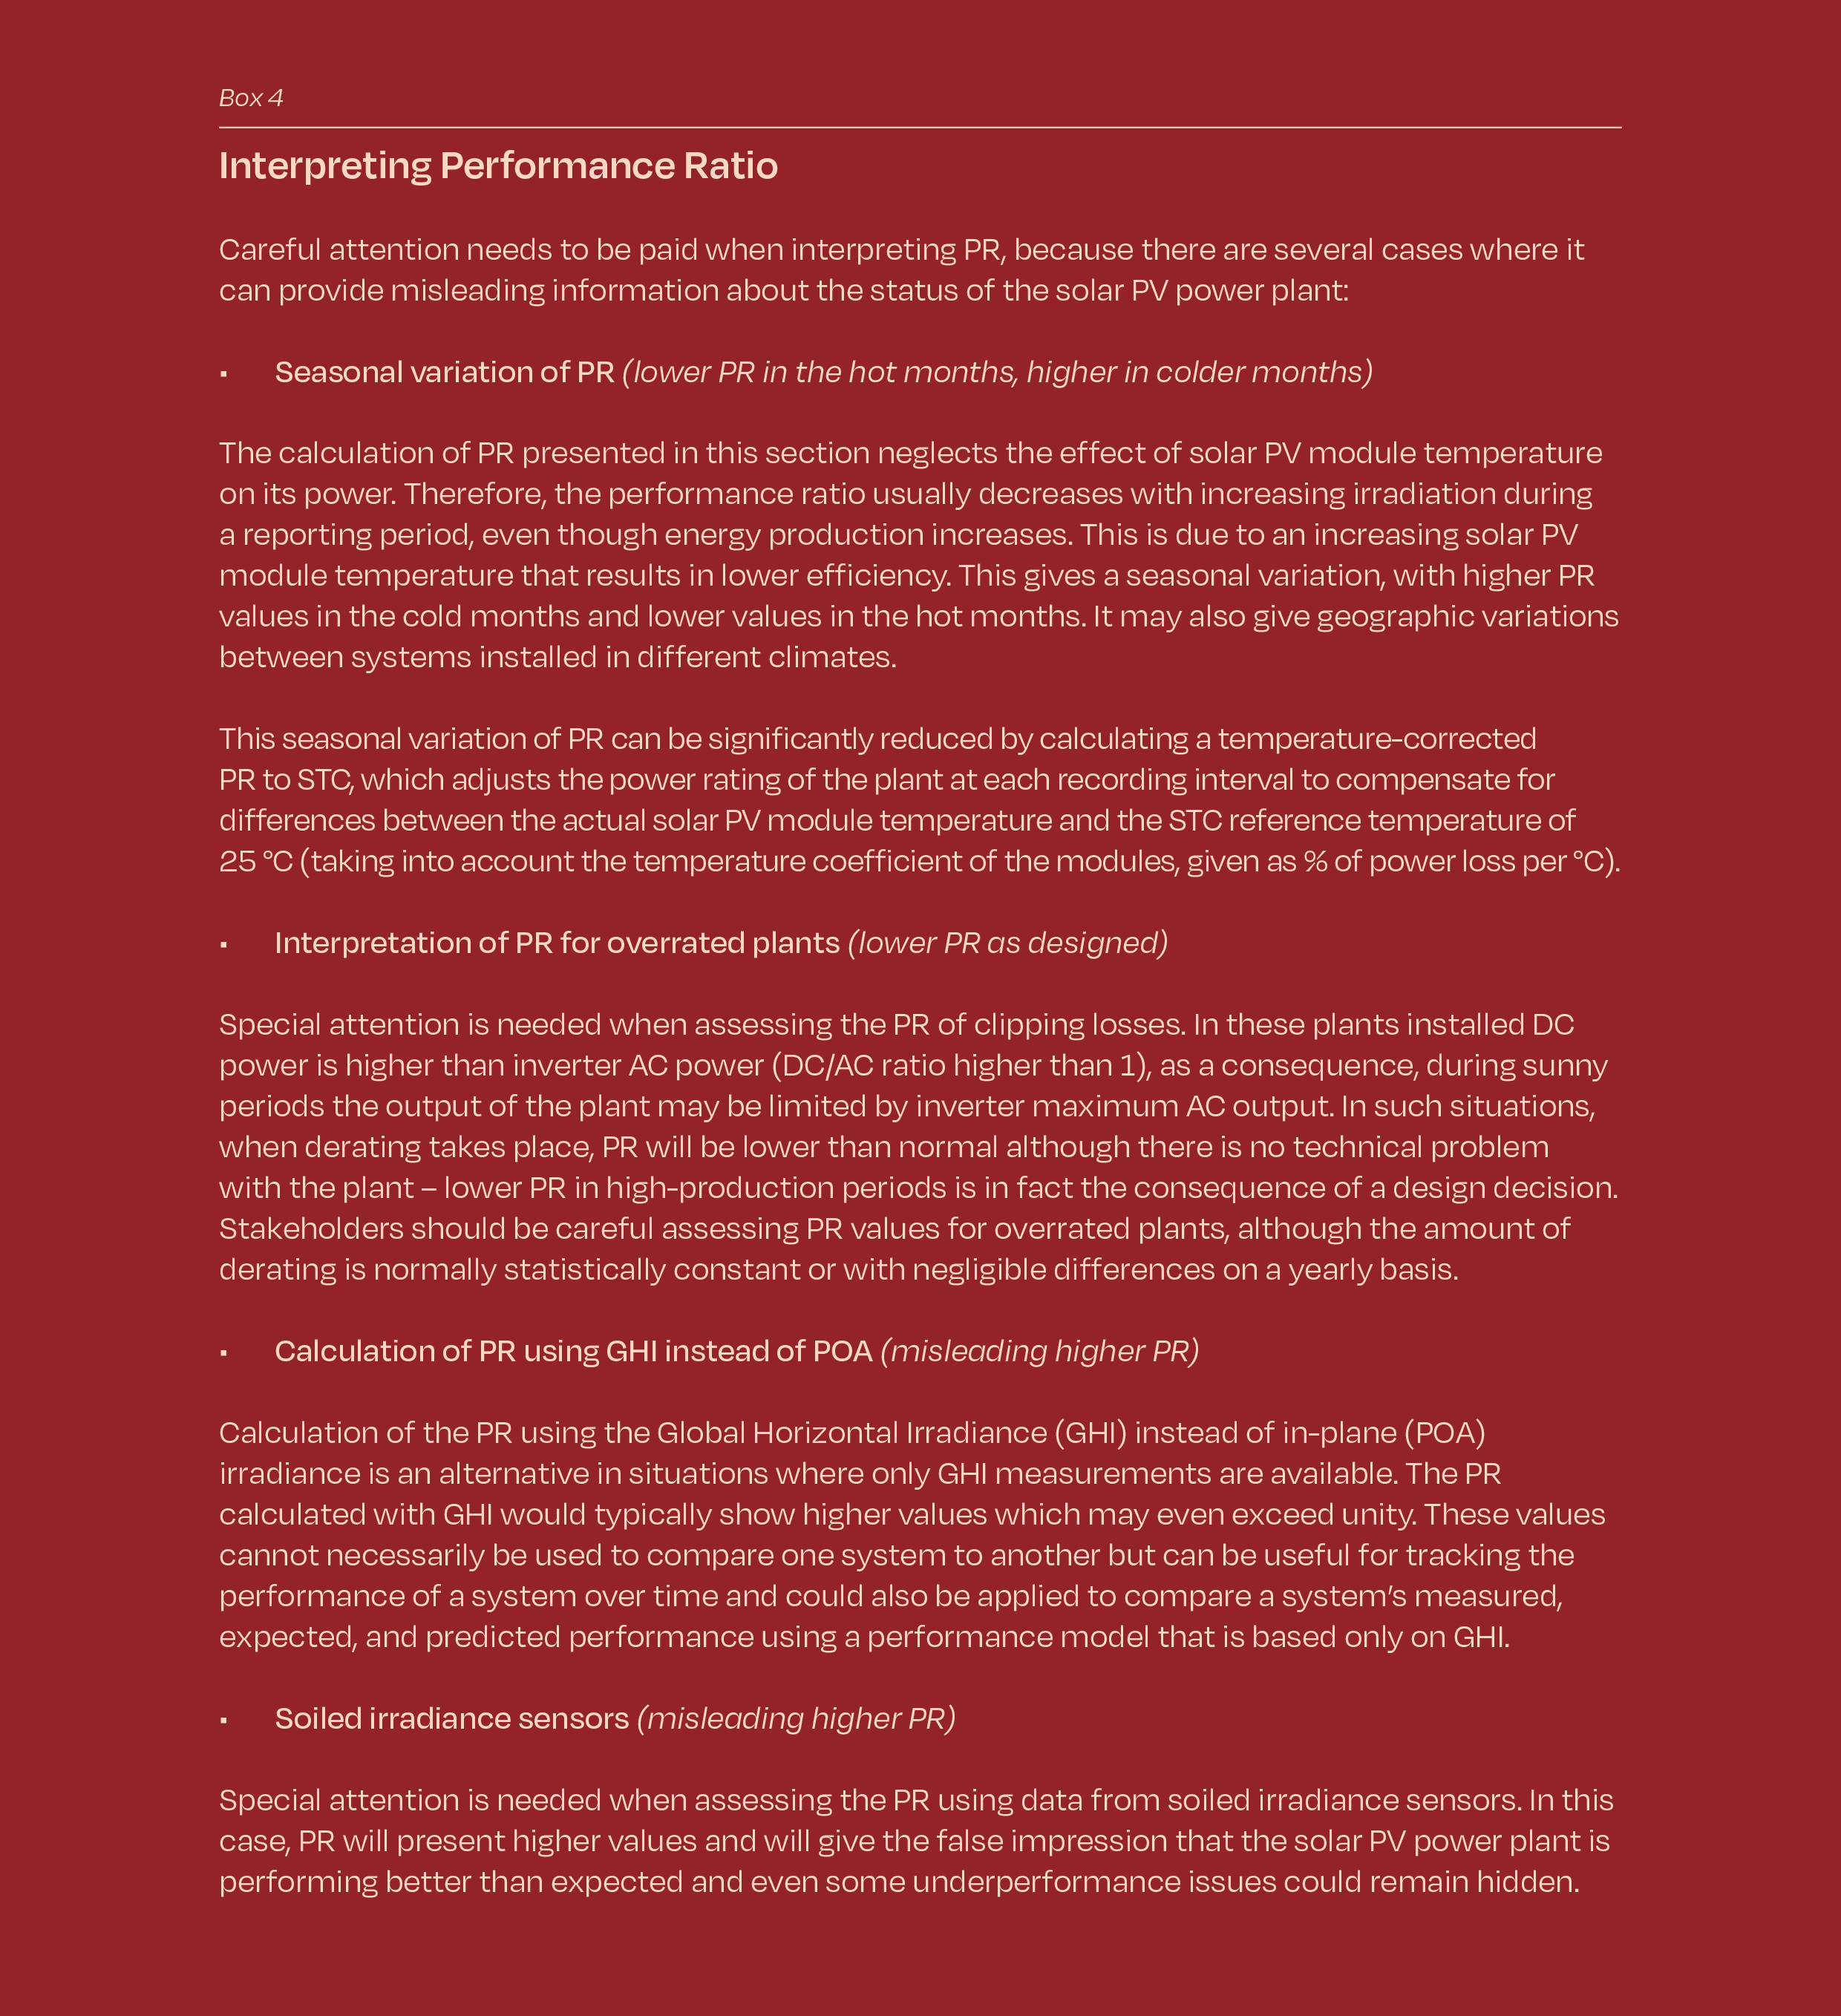
Performance Ratio (PR)
PR is a quality indicator of the solar PV power plant. As the ratio between the actual Specific Yield and the theoretically possible Reference Yield, PR captures the overall effect of solar PV system losses when converting from a nameplate DC rating to AC output. Typically, losses result from factors such as module degradation, temperature, soiling, inverter losses, transformer losses, and system and network downtime. The higher the PR is, the more energy efficient the plant is.
PR, as defined in this section, is usually used to report on longer periods of time according to the O&M contract, such as month or year. Based on PR, the O&M service provider can provide recommendations to the plant Owners on possible investments or interventions.
These definitions are based on (Woyte et al. 2014) in line with IEC 61724-1:2017 and are common practice. PR is measured for available times at the inverter or plant level.
Note that special attention is needed when assessing the PR of overrated plants, where the output of the plant is limited by the inverter’s maximum AC output. In such situations, and for the period that overrating takes place, PR will calculate lower than normal although there is no technical problem with the plant. Stakeholders should be careful assessing PR values for overrated plants, although the amount of overrating is normally statistically constant or with negligible differences on a yearly basis.
Temperature-corrected Performance Ratio
In some situations, such as a commissioning test or solar PV power plant handover from one O&M service provider to another, PR needs to be measured over a shorter period, such as two weeks or a month. In such situations, using a PR formula corrected with temperature factor is recommended. This can help neutralise short-term PR fluctuation due to temperature variations from STC (25°C). As a best practice, temperature should be registered with a granularity of up to 15 minutes (referred to as period j below) and the average temperature for the time period i should be calculated by weighting the mean temperatures of the time periods j according to Specific Yield of this time period.6

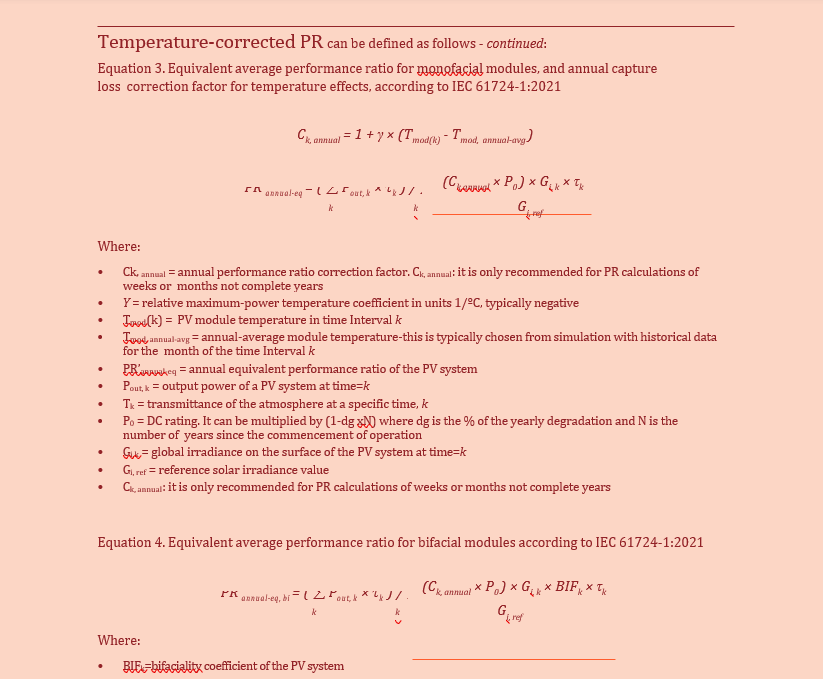
Equivalent annual temperature corrected performance ratio
The equivalent annual performance ratio is another relevant metric for assessing the performance of a PV system. It provides a normalised system performance that accounts for seasonal variations and
long-term environmental conditions. It provides a reliable indication of system efficiency and identifies deviations from expected performance, enabling targeted O&M actions. For bifacial PV modules, it helps factoring in the impact of varying albedo and irradiance conditions on both sides of the panel when considering the bifaciality coefficient, aiding in detecting underperformance or system faults.
Overall, this metric is relevant for data-driven decision-making in O&M by providing a standardised, comprehensive evaluation metric tailored to the specific characteristics of modern PV technologies.
Expected Yield
Expected Yield Yexp(i) is the Reference Yield Yr(i) multiplied by the expected PR and thus expresses the Specific Yield that has been expected for a certain period i.
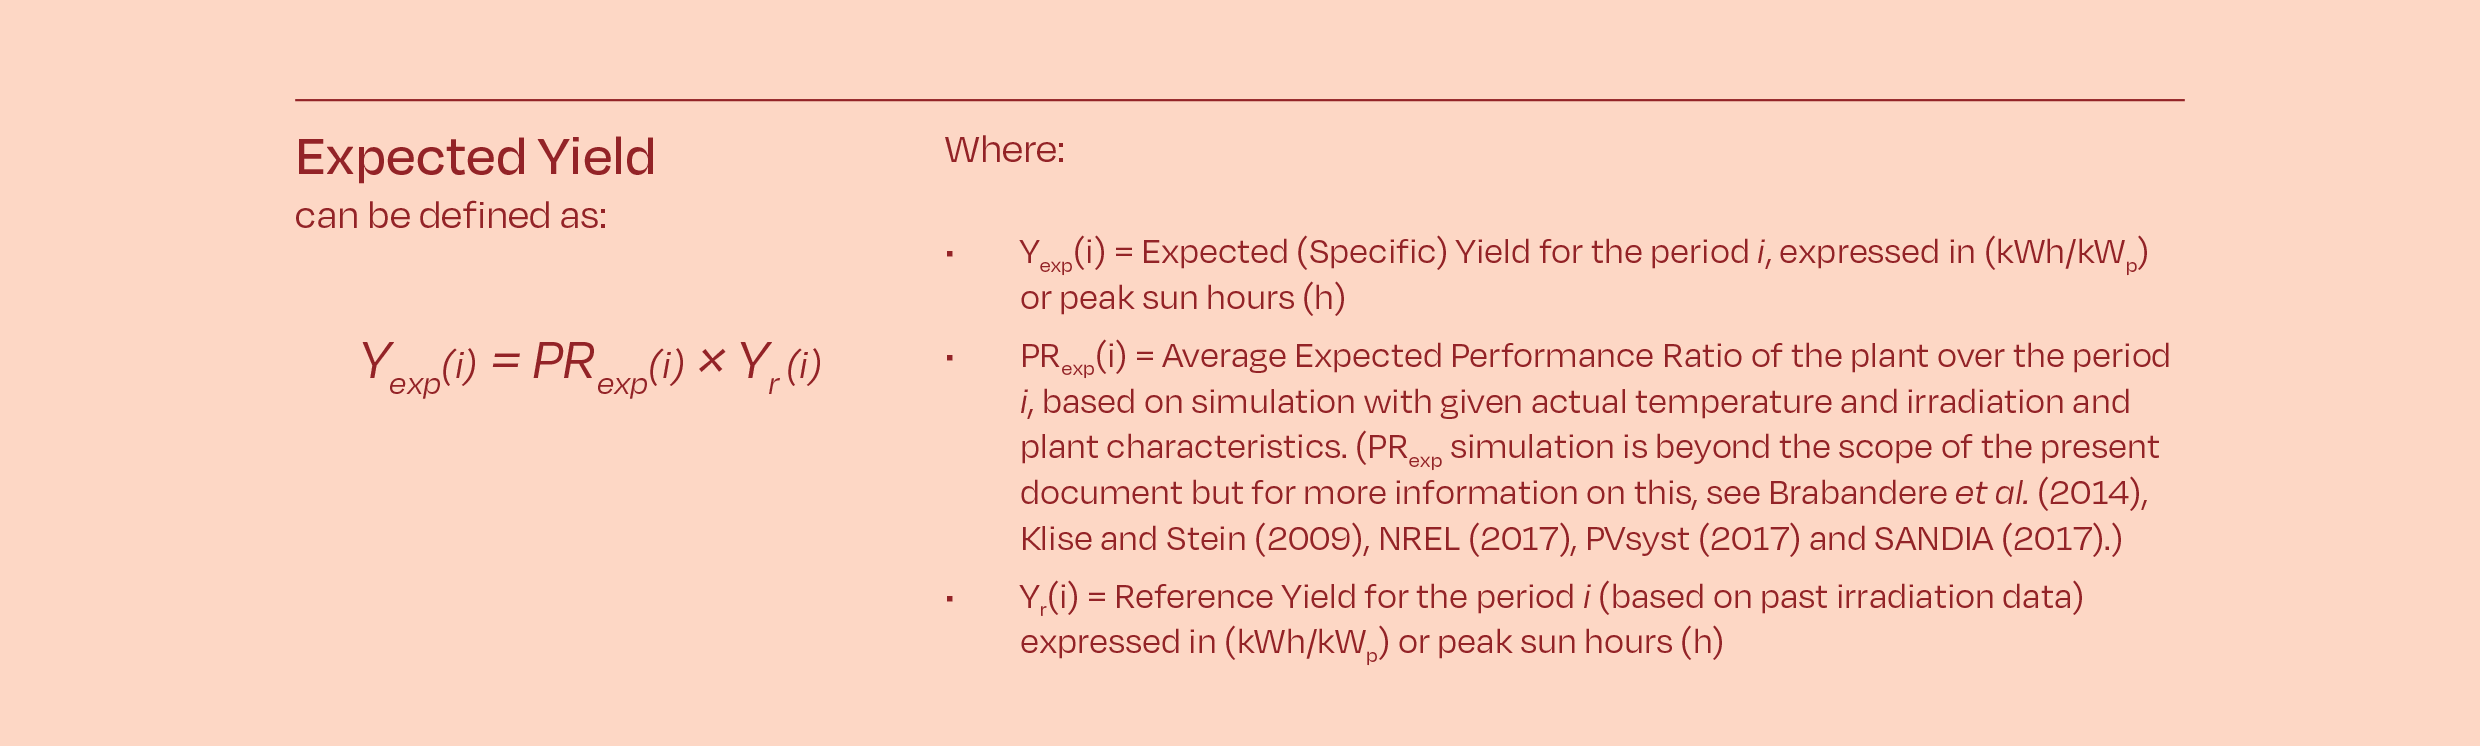
Note that Expected Yield is based on past values of irradiation data. Predicted Yield is based on forecasted data, from day ahead and hour ahead weather reports.
Energy Performance Index
The Energy Performance Index (EPI) is defined as the ratio between the observed Specific Yield Yf(i) and the Expected Yield Yexp(i) as determined by a solar PV model. The EPI is regularly recalculated for the respective assessment period (typically day/month/year) using the actual weather data as input to the model each time it is calculated. This concept was proposed in Honda et al. 2012.

The advantage of using the EPI is that its expected value is 100% at project start-up and is independent of climate or weather. This indicator relies on the accuracy of the model.
Unfortunately, there is more than one established model for calculating the Expected Yield of solar PV systems in operation and not all of them are transparent. Therefore, the use of EPI is recommended mainly for the identification of performance flaws and comparison of plants.
Technical Availability or Uptime
Technical Availability (or Uptime), Contractual Availability and Energy-based Availability are three closely related indicators to measure whether the solar PV power plant is generating electricity.
Technical Availability is the parameter that represents the time during which the plant is operating over the total possible time it can operate, without taking any exclusion factors into account. The total possible time is considered as the period when the plant is exposed to irradiation levels above the generator’s Minimum Irradiance Threshold (MIT). Technical Availability is covered extensively in IEC TS 63019:2019.
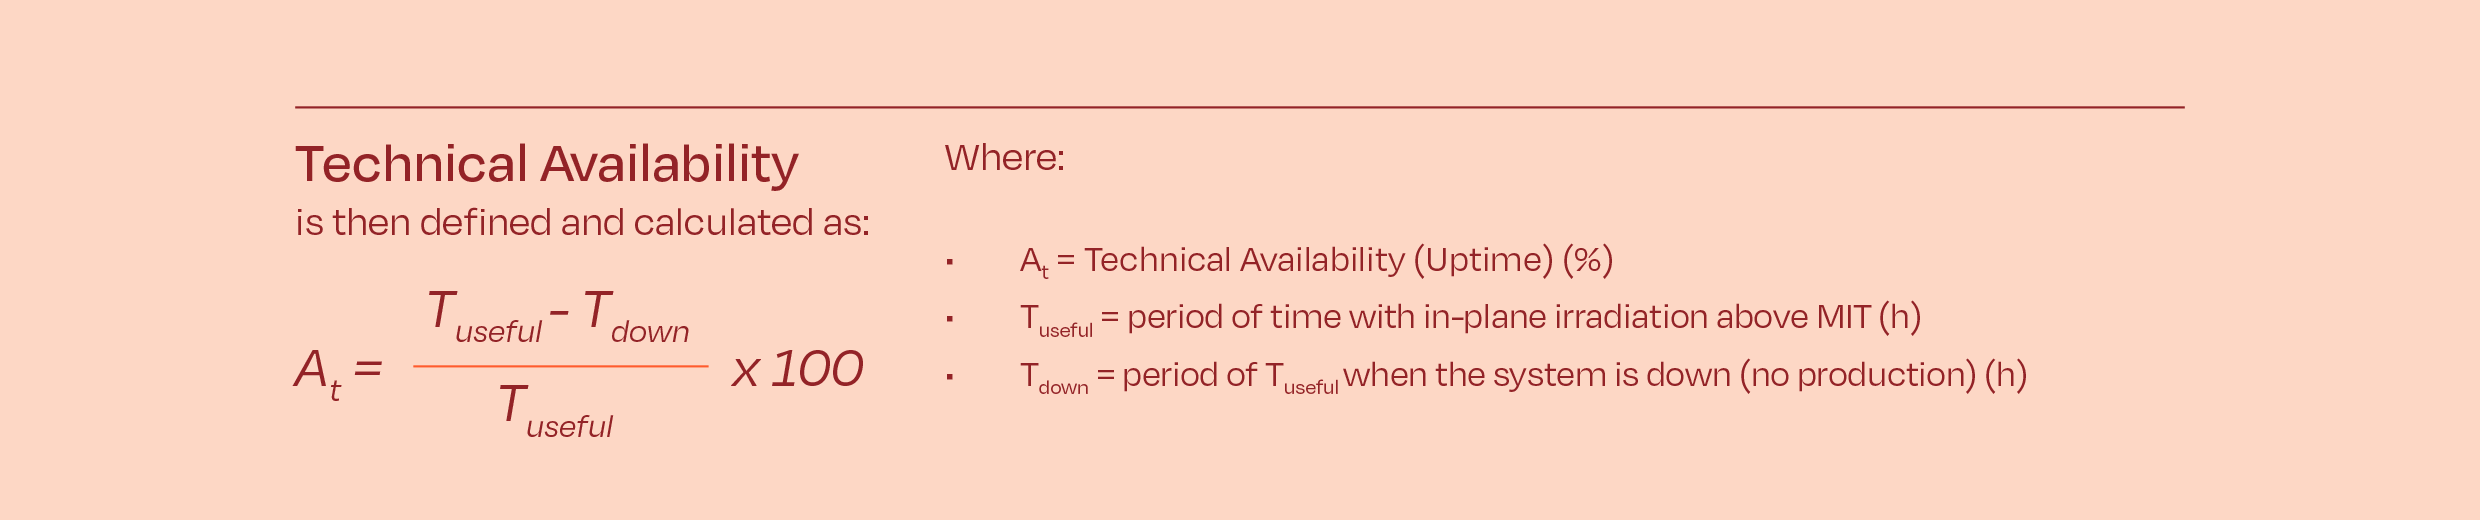
In the context of calculating Technical Availability for a solar PV plant, Uptime and Downtime refer to the periods when the plant is operating normally versus when it is not.
• Uptime: This refers to the time when the plant is generating power and functioning correctly. It is the period during which irradiance is above the Minimum Irradiance Threshold (MIT), which is typically around 50 or 70 W/m², depending on the plant’s characteristics. This period is referred to as Tuseful, and it excludes times when irradiance is below MIT, as this is not sufficient for power generation.
• Downtime: This refers to the period when the plant is not generating power due to various factors such as equipment failure, maintenance, or when irradiance falls below the MIT threshold. During this time, the plant is not producing power, which negatively impacts its availability.

The figure below illustrates the various periods in time mentioned above.
Normally, only the time where irradiance is above the MIT is considered and this is noted above as Tuseful, where Tuseful = Ttotal – T(irr<MIT). Typical MIT values are 50 or 70 W/m2. MIT should be defined according to site and plant characteristics (e.g. type of inverter, DC/AC ratio etc).

Technical Availability should be measured also at inverter level. Individual inverters’ Technical Availability At k should be weighted according to their respective installed DC power Pk. In this case, the Technical Availability of the total solar PV power plant At total with a total installed DC power of P0 can be defined in the box below.
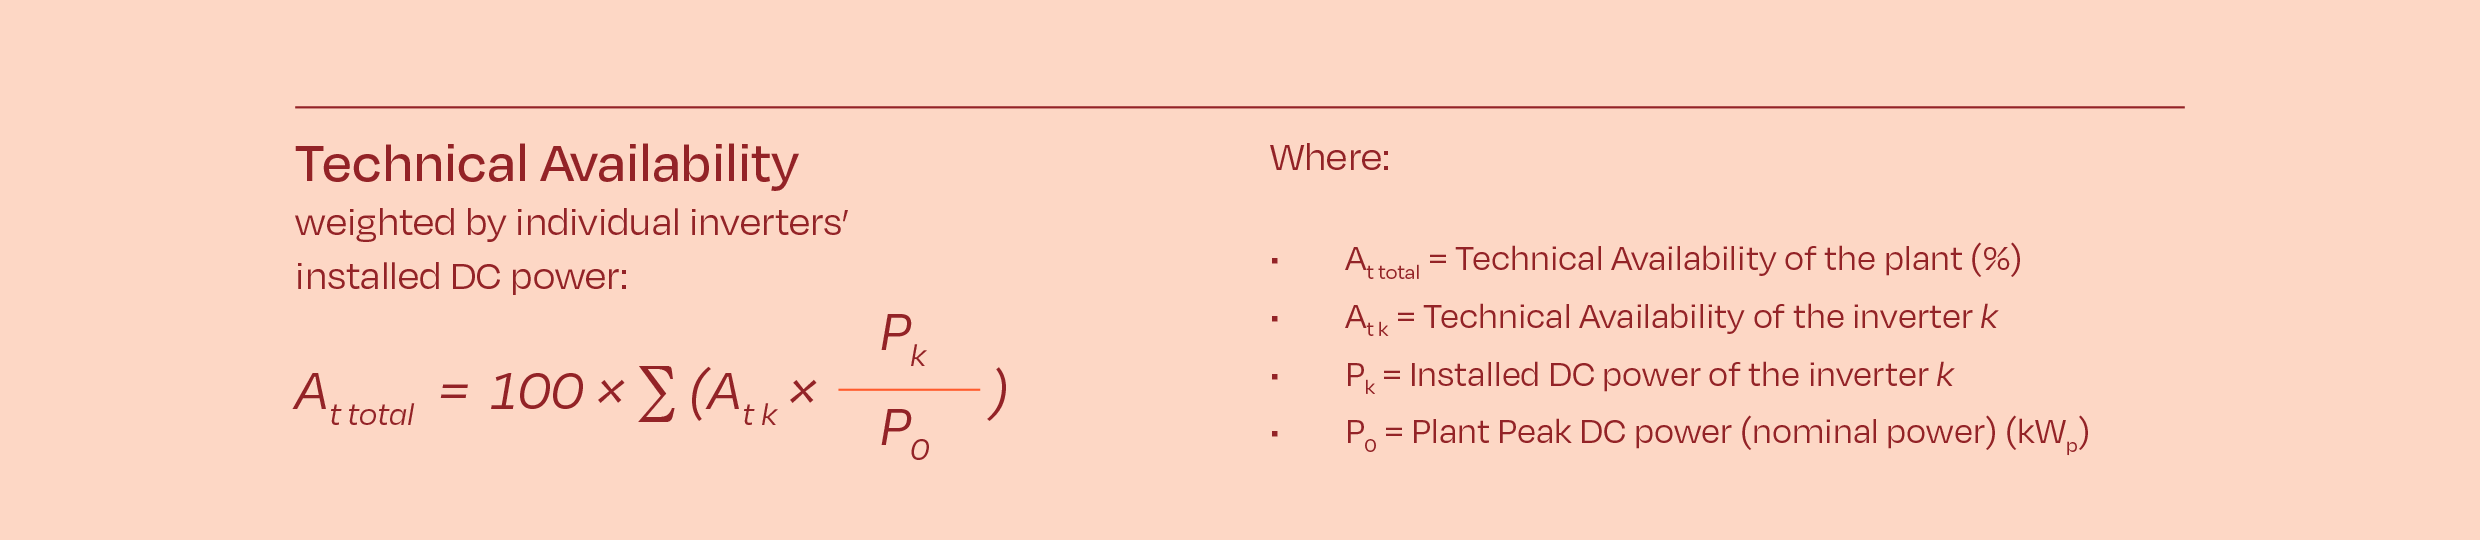
For the calculation of Technical Availability, typically up to 15 minutes of irradiation and power production data should be taken as a basis if granularity of components remains at the level of inverter or higher. Anything below the level of inverter is then captured with the PR calculation presented above.
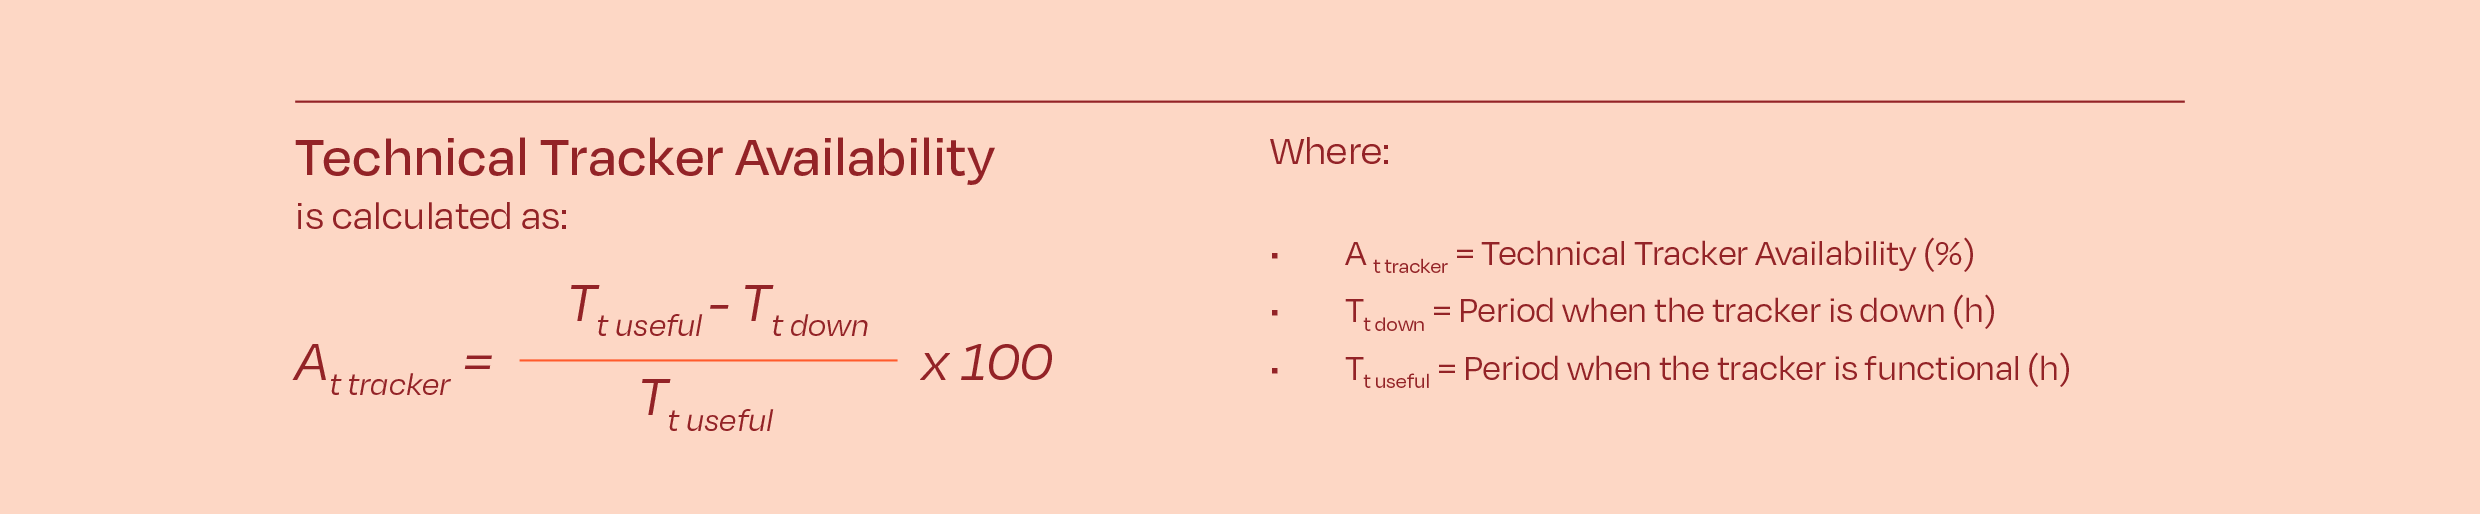
Technical Tracker Availability or Tracker Uptime
Similar to Technical Availability, Technical Tracker Availability is simply a ratio of the useful time compared to the uptime or downtime of the tracker. This measurement is a purely technical parameter and would not allow for any agreed exclusions in the availability. To calculate the technical tracker availability, the following formula in the box below can be used.
Tracking Performance Availability
Functional failure of a tracker can count as inaccurate, or out of sync tracking compared to the set point. This failure can often lead to shading or small performance deviations, based on the deviation from the sun path. The formula for the tracker’s performance availability is like the technical availability. Tt down is defined as the period during which deviation of the tracker’s tilt is higher than the accepted deviation angle (e.g. greater than 5° of angle deviation). This metric can help to improve single-or dual-axis tracking performance.
Solar PV power plant healthiness KPI
As opposed to raw data and power plant KPIs, healthiness KPI are essential to provide an overview of the physical status of a PV power plant. Healthiness KPI can be established following physical third- party reviews verifying and validating the physical state of a PV power plant in regular intervals. A PV power plant physical health review can include the entire system, including state of components such as e. g. modules (incl. IR measurements, EL measurements), inverters, cables, connectors, junction boxes, fixed tilt or tracked substructures, and ultimately, by connecting the information and resulting data streams from these individual items, of the entire PV power plant.
Such inspections result in KPI that can be established by using a comprehensive technical rating system. One such example is the expected upcoming IECRE rating system, of which the concept is currently in the voting process at the IEC Conformity Assessment Board (IEC CAB). A rating contains a comprehensive weighted points system to differentiate the relevance of the various check points. The result is valid for a defined period, and a re-rating can be performed in regular intervals (e. g. annually). The final points are correlated with previous rating results e. g. from the inception phase and previous (annual) assessments, and linked with a nexus by using algorithms. The results serve as an indicator of the healthiness of a PV power plant as well as of the to be expected performance related to the physical condition of a PV power plant for the released validity period. The O&M part of the rating assessment is illustrated on the righthand side of Figure 11.

10.2. O&M service provider KPIs
As opposed to power plant KPIs, which provide the Asset Owner with information about the performance of their asset, O&M service provider KPIs assess the performance of the O&M service.
The expected IECRE rating system outlined above is as well available for rating the O&M service provider as well as the O&M service KPI.
The following time KPIs are illustrated in Figure 12 below.
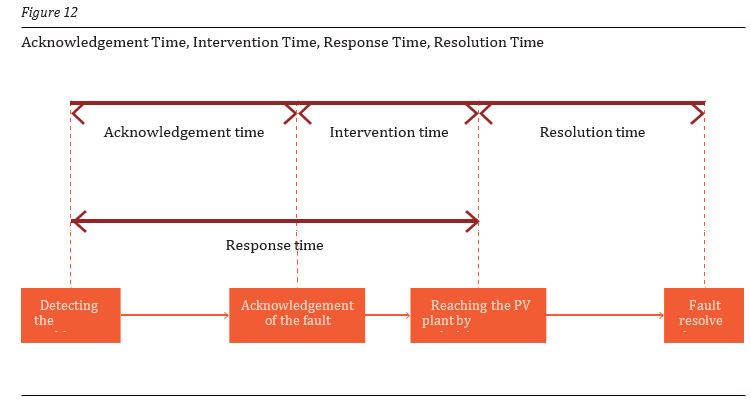
Acknowledgement Time
The Acknowledgement Time (also called Reaction Time) is the time between detecting the problem (receipt of the alarm or noticing a fault) and the acknowledgement of the fault by the O&M service provider by dispatching a technician. The Acknowledgement Time reflects the O&M service provider’s operational ability.
Intervention Time
The Intervention Time is the time between the acknowledgment of a fault and the arrival of a service technician or a subcontractor at the plant. Intervention Time assesses the capacity of the O&M service provider, and how fast they can mobilise and be on site. It is worth noting that, in certain cases remote repair is possible, or the O&M service provider is not able to repair the fault and third-party involvement is necessary.
Response Time
The Response Time is the Acknowledgement Time plus the Intervention time. Used for contractual purposes, minimum Response Times are guaranteed based on fault classes, classified on the basis of the unavailable power, the consequent potential loss of energy generation, and the relevance of the failure in terms of their safety impact.
Resolution Time
Resolution Time (or Repair Time) is the time taken to resolve a fault, starting from arrival at the solar PV power plant. Resolution Time is generally not guaranteed as resolution often does not fully controlled by the O&M service provider.
Reporting
It is very important for the O&M service provider to comply with reporting requirements and reporting timelines. The Asset Owner may only obtain operational updates from the plant through this reporting, and therefore this is a major contribution to assessing the performance of the O&M contractor. Content and timing of the reporting is generally agreed by the parties in the Contract agreement. Content of the reporting is expected to be consistent and any change in content or format needs to be explained by the O&M service provider. Delivery of reports per the agreed upon timeline is an important indicator for reliability and process adherence within the O&M service provider’s organisation. For more information see Chapter 6.1 in Solarpower Europe’s report Asset Management Best Practices Guidelines V.2 (www.solarpowereurope.org).
O&M service provider experience
Experience of the O&M service provider with solar PV power plants in a particular country, region, grid environment and/or with solar PV power plants equipped with certain technology or size can play an important role. This is relevant for the selection of the O&M service provider and can be tracked by the Owner over time (track record).
Schedule Attainment
Schedule Attainment (or Schedule Compliance) is the ability of the O&M service provider to execute the Preventive Maintenance schedule within the required timeframes (typically across a period of a week or month).
O&M service providers who adhere to the schedule ensure accomplishing as much preventive maintenance and other timely corrective work as possible. Schedule Attainment provides a measure of accountability.
Low Schedule Attainment can provide key warning signs to the Asset Owner regarding the O&M service provider:
• That preventive maintenance is not done which will lead to equipment failures over time
• The O&M service provider might not have sufficient numbers of qualified technical staff to performance maintenance
• The O&M service provider systems such as the management of stores and spares, procurement processes are not effective
• There may be high levels of corrective maintenance work – which could be due to unsolved technical issues
Notifying proactively and providing remediation plans to the technical asset manager in times of low schedule attainment will contribute in managing expectations.

Preventive vs. Corrective Maintenance ratio
This metric measures the reactive nature of the plant maintenance work. Asset Owners and AMs prefer a higher proportion of Preventive maintenance than Corrective Maintenance. This indicator is based on the actual hours technicians spend on jobs. The actual hours are measured regardless of the originally estimated hours of the planners.
When the O&M service provider has control over the equipment, the O&M service provider decides when to take certain actions to preserve equipment. When the equipment has control over the O&M service provider, the equipment drives the efforts of maintenance. A more reactive plant environment has more circumstances of the equipment experiencing problems and causing
the O&M service provider to break the weekly schedule. A more proactive one experiences few circumstances of sudden equipment problems interrupting scheduled work.
Best practice requires that the ratio of Preventive vs. Corrective Maintenance is 80/20.
10.3. Solar PV power plant/O&M service provider KPIs
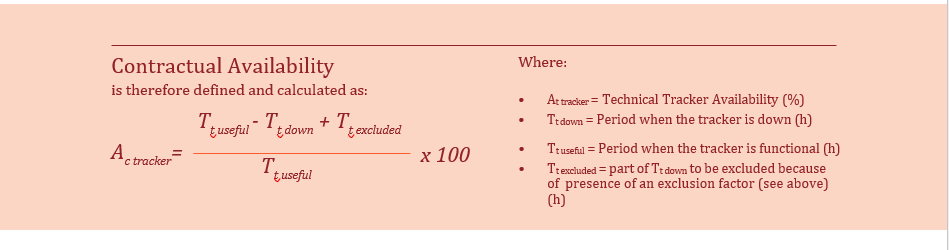
Contractual Availability
Contractual Availability is Technical Availability with certain contractually agreed exclusion factors (see below) applied in the calculation; It is used as a basis for evaluating the general Contractual Availability guarantees provided by the O&M service provider and included in the O&M Contract. A best practice is a Minimum Guaranteed Contractual Availability of 98% over a year. (For more details on Availability guarantee provided by the O&M service provider, see Section Availability Guarantee).
Contractual Availability is the parameter that represents the time in which the plant is operating over the total possible time it is able to operate, taking into account the number of hours the plant is not operating for reasons contractually not attributable to the O&M service provider (listed below in the same section).

Figure 13 on the following page illustrates the various periods in time mentioned above.
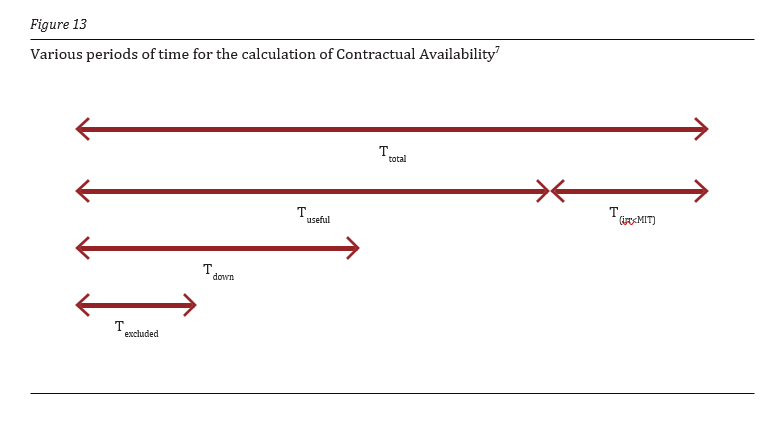
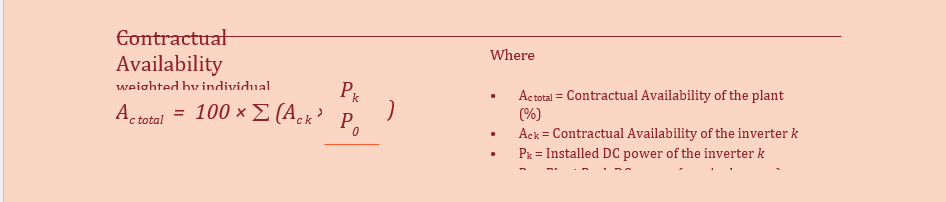
Like Technical Availability, Contractual Availability is also calculated for irradiance levels above the MIT and measured at inverter level. Individual inverters’ Contractual Availabilities ACk should be weighted according to their respective installed DC power Pk. In this case the Contractual Availability of the total solar PV power plant Ac total with an installed total DC power of P0 can be defined as show in the box below.
For the calculation of Contractual Availability, typically up to 15 minutes of irradiation and power production data should be taken as a basis if granularity of components remains at the level of inverter or higher. Anything below the level of inverter is then captured with the PR calculation presented earlier.
As Contractual Availability is used for contractual purposes, any failure time should only begin to run when the O&M service provider receives the error message. If the data connection to the site was not available due to an external issue that is beyond the O&M service provider’s responsibility, failure time should only begin after re-establishment of the link. However, if the data connection was lost due to the unavailability of the monitoring system, the failure time should count. In general, the O&M service provider should immediately look at the root cause of the communication loss and resolve it.
The Asset Owner and the O&M service provider should agree on certain failure situations that are not included (exclusion factors) in the calculation of Contractual Availability. Evidence should be provided by the O&M service provider for any exclusion factor and the reason for excluding the event must not be due to an O&M service provider fault. Some good examples for exclusion factors are:
• Force majeure
• Snow and ice on the solar PV modules
• Damage to the solar PV power plant (including the cables up to the feed-in point) by the customer or third parties who are not sub-contractors of O&M service provider, including, but not limited to, vandalism
• Disconnection or reduction of energy generation by the customer or as a result of an order issued to the customer by a court or public authority
• Operational disruption by grid disconnections or disruptions caused by the grid operator
• Disconnections or power regulation by the grid operator or their control devices
• Downtimes resulting from failures of the inverter or MV voltage components (for example, transformer, switchgear), if this requires
• Technical support of the manufacturer and/or
• Logistical support (for example supply of spare parts) by the manufacturer
• Outages of the communication system due to an external issue that is beyond the O&M service provider’s responsibility. Any failure time only begins to run when the O&M service provider receives the error message. If the data connection to the site was not available, failure time shall only begin after re-establishment of the link
• Delays of approval by the customer to conduct necessary works
• Downtimes for implementation of measures to improve the solar PV power plant, if this is agreed between the parties
• Downtimes caused by the fact that the customer has commissioned third parties with the implementation of technical work on the solar PV power plant
• Downtimes caused by Serial Defects on Plant components
• Depending on the O&M contract, time spent waiting for some spare parts to arrive can be excluded from the calculation of Contractual Availability. However, this is not considered a best practice
Contractual Tracker Availability
Like Contractual Availability, Contractual Tracker Availability also makes allowance for pre-defined exclusions, like maintenance, panel cleaning, etc. A similar formula is used to the technical availability with provision made for any predefined contractual exclusions (see above). The formula can be seen in the box on the following page.
Energy-based Availability
Energy-based Availability takes into consideration that an hour in a period of high irradiance is more valuable than in a period of low irradiance. Therefore, its calculation uses energy (and lost energy), instead of time, for its basis:
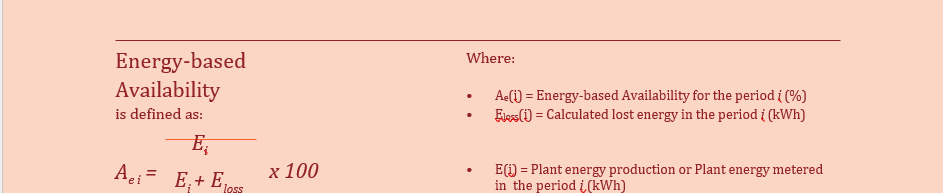
Generally, the Energy Based Availability is used within the O&M Contract in the Availability guarantee chapter and the exclusion factors defined for Contractual Availability tend to apply for Energy-based Availability too.
The following table provides an overview of different types of KPIs and their main purposes.

