Onboarding Best Practice Guidelines
Certified electrician
2.1. Construction and operation under EPC warranty
2.1.1. Construction and installation
PV modules
Modules are the engine of the final system and represent a significant proportion of a project’s CAPEX and labour corrective maintenance measures need to be carried out. In the planning phase one should verify that modules are, in theory at least, capable of operating in the given working environment for the anticipated lifetime and with the assumed durability. It is often wrongly assumed that this will be the case if the module type has passed the IEC 61215 / IEC 61730 type / safety approval test. These standards have been one of the most successful contributions to reducing problems in the array field but are only a design qualification standard. They are limited to evaluating known failure mechanisms and assume a moderate climate. Examples of failure modes being missed include backsheet issues or PID and Light and elevated Temperature Induced Degradation (LeTID) related issues. The main impact has been to reduce early failures in the first few years in operation. It does not give any information on the durability of a module, nor does it verify the quality of the product actually being installed, just the general suitability of the product family for the intended application.
Ideally one should verify whether the modules will operate at conditions represented by the tests they have undergone or account for an increased quality risk if conditions in the field are expected to be out of the test standard’s scope. An example of modules potentially operating outside tested specification could be building integrated mounting or systems in arid climate zones, as such systems may run much hotter than they have been tested for. IEC TS 63126 Guidelines for qualifying PV modules, components, and materials for operation at high temperatures gives guidance on testing modules and components for high temperatures. As some standards also allow variants of test conditions based on manufacturer’s definition, reviewing the testing protocol alongside the certificate is recommended.
Integrating testing requirements for PV modules in the procurement conditions allows for claims against underperformance as well as identifying design deficiencies. PV modules from one system supplied by various production sites or batches may require separate assessment.
There are three groups of quality tests described:
1. Performance characterisation testing
2. Qualification testing
3. Module Reliability Tests (Stress Tests, Accelerated Aging Tests)
Performance characterisation testing mainly addresses the electric performance of the PV modules and the condition of the cell interconnection circuit (cell cracks or interrupts). Regarding the power warranty, the performance of the entire delivery can be deduced from a random sample according to ISO 2859-1. As budget and timing is usually critical, mostly General Inspection Level based on the total number of modules per production batch is applied. As an alternative, a combination of a smaller sample size (e.g., 50 per batch) and the manufacturer’s flash list will allow a robust product verification if the measurements have been carried out with a sufficiently low uncertainty and the service provider has an appropriate quality system. It is advisable to combine power measurement with electroluminescence imaging for crack detection. The performance at low irradiance is something needed for the energy yield calculation, but samples size can be small (e.g., S 1). In the absence of third party verified PAN files it is advisable to base PAN files on independent measurements as simulations based solely on data sheet information may lead to high uncertainties in energy yield simulation.
Product qualification tests are typically destructive or longer-term tests and sample sizes are kept smaller. It is important to perform tests on modules that represent the material combinations (bill of materials) of the module type. The tests shall check the functioning manufacturing processes, the production control and are helpful in determining general workmanship. Some suitable qualification tests are defined in the standard IEC 61215-2, which is the basis for type approval and design qualification of PV modules. The sampling method is typically Special Inspection Level S 1 to S 3 acc. to ISO 2859-1 with consideration of all bills of materials and potentially different production lines to be represented. Induced degradation tests (such as PID and LeTID) are screening tests and are suggested if sufficient proof of resistance to such degradation is not provided. Here sampling rate could be reduced to two modules per bill of materials to minimise testing cost.
Product reliability tests shall evaluate the long-term behaviour with a focus on module performance but also on electrical safety. Several test sequences for investigating a module’s resistance to environmental conditions, such as high UV level, strong temperature changes, high temperatures combined with high relative humidity and mechanical stress both from wind forces and snow loads are described in IEC TS 63209 Photovoltaic modules - Extended-stress testing - Part 1: Modules. Depending on the application and the project region the stress level may vary. The suggested sample size is two modules per test and bill of materials. In particular polymeric material degradation has caused major reliability concerns in the recent years. Here the technical specification, issued in 2021, provides a combination of damp heat testing, UV testing and thermal stress in its sequence three that is designed to screen for long-term backsheet failures.

Inverters
The inverter is one of the most complex components in a PV power plant and includes multi-functional power electronics for optimising the power output. This element is the interface with the grid and reads and communicates operational data to the monitoring system. A fault with the inverter leads to an immediate decrease in power output, which grows in proportion to the size of the inverter. Owners should not simply rely on data sheets but invest in quality review services, conducted by experienced technical advisors. In a quality assurance process, the key steps of design, manufacturing, installation, and commissioning are independently evaluated, to prevent potential issues that could decrease performance across the inverter’s lifecycle.
The key risk mitigation steps are a factory audit, the review of a manufacturer’s factory-out inspection and the commissioning, which are presented in sections 7.3. Supply review. and 7.4. Delivery.
Aside from the general comments above, key areas for potential issues with inverters include:
· Adaptation to voltage and power design
· Isolation issues
· Blocked air vents, filters etc.
· Derating characteristic of inverters, high temperature shut off
· Rating or spacing not suitable for location (e. g. high altitude)
· Grid code compliance
· Unavailable required national certification
· Inverter metrology
· Interference with radio signals etc. (electromagnetic compliance and adaptability)
· Optimisers
· Local transportation including unloading opportunities
· Local service
Inverters need to be chosen depending on system topology. There is no formal assessment available currently, but a risk assessment when choosing a system topology considering performance, maintainability, impact of failures, likelihood of failure and reparability. As an example, a central inverter may have a higher efficiency, be cheaper to install, but in case of a failure takes down the system and will take weeks to repair, while spare string inverters could be stocked, and any failure could be corrected in a short time. The evaluation of risks will depend on design objectives, but it should be documented for later verification and any future process improvements.
When planning a system, it is critical to match the operating characteristics of the inverter (efficiency, load-related derating, voltage window) to the real operating conditions.
Sufficient diligence needs to be exercised when it comes to:
· Specific requirements for inverters, e.g., compliance with (EU) 2016/631 for Europe
· Performance characterisation testing (INV File generation for energy yield simulations)
· Product qualification testing
· Product reliability testing according to appropriate standards
Electric general and technical lead
A. Construction
In this phase, the solar power plant is installed based on installation manuals provided by suppliers to assure the proper storage, handling and installation of mounting systems, PV modules, inverters, transformers, cabling, monitoring system/sensors and other balance of system components. It also ensures the quality of the installation as well as the long-term stability of the PV system.
A proper schedule and preparation of several activities around the construction are important and should preferably be organised according to common project management techniques. This includes clear definition of objectives, activities, and responsibilities (who does what?), time plans and milestones (when?), cost planning, and quality assurance. To achieve this, an effective and efficient communication, documentation and reporting flow between the Asset Owner, the EPC service provider and the subcontractors is necessary. This will help encourage accountability, potential construction defects are promptly identified, high standards upheld, and monitoring the EPC service provider’s performance is easier.
The overall construction activity can be divided into two phases: firstly, the preparatory phase, related to the preliminary activities and secondly, the construction implementation phase, including site preparation, civil, mechanical, and electrical works necessary to complete the plant and bring it to the production phase.
Construction preparatory phase
The construction preparatory phase includes those planning and preparatory activities that ensure the smooth realisation of the PV plant. For this purpose, it is important that the construction project is correctly set up according to project management principles: the Asset Owner and the EPC service provider define project organisation and objectives, arrange main parts of the project in a work-breakdown structure (WBS), deduce a time schedule with clearly defined work packages, including responsibilities/accountabilities (responsibility matrix, for example, a RACI matrix), interdependencies, duration and resources. This time schedule shall be the reference for monitoring the project’s progress from both a physical and cost control perspective and needs to be regularly updated.
Site survey
The site survey aims at checking that there are no physical and geographical constraints or inconsistencies with the assumptions and technical details defined in the Execution design (see Chapter 6 on Engineering). If there are inconsistencies between the execution design and the site survey, the EPC service provider should consider doing another topographical survey with a drone.
The survey is also necessary for checking the actual status of the site and for planning the preliminary activities necessary to prepare the site for the mobilisation of personnel and equipment and the start of the main construction activities.
While the effective mobilisation of the EPC service provider and their subcontractors usually takes place once contracts enter into force (in general when a notice to proceed is issued by the Asset Owner), the execution of certain early works, sometimes also called preliminary works, is a project strategy that is becoming more frequent.
With reference to construction activities set-up, the key topics to be investigated during the site survey are:
· Mapping of the construction site (allotment and boundaries, topography, etc.)
· Definition of the area for temporary facilities and storage/warehouse
· Identification and mapping (geolocalisation) of interferences to be considered during construction, for which drones can be used
· Assessment of critical elements for construction and identification of mitigating actions (technical risks, rests of bombs, hazardous waste, but also archaeological discoveries)
· Detailed survey of transportation facilities and routing and other logistic items
· Execution of the pull-out test, necessary for the final test of the selected foundation design of the mounting structures.
Stakeholder management
The primary tool for understanding the context in which the project is implemented is to identify and understand the stakeholders involved in, or affected by, the project. This allows one to become aware of their expectations and to determine the effective, potential, or perceived impact that the project can have on them identifying methods for involving them.
The identification of the stakeholders and their needs and expectations requires suitable knowledge of the relationships that exist between the different actors that are present and active in a given context. For this purpose, all subjects that could influence or be influenced by the project must be considered.
It is important that the identification of the stakeholders is not limited to local and administrative authorities but should also consider people and organisations that are relevant for local communities, as they represent their interests and identity.
Construction preparation plan
Construction Planning aims at planning all construction activities properly and guaranteeing that resources are available and scheduled consistently with activities. This avoids any unplanned stops.
After definition of the project scope of work, the project management team structures the project by organising the activities in a hierarchical structure, the Work Breakdown Structure (WBS). Only the activities identified with the WBS shall be within the project scope and, therefore, can be planned and controlled. There is only one WBS per project. A well-defined WBS:
· Provides complete definition of the project scope at different levels
· Allocates tasks and responsibilities
· Defines a numbering system, which is used as reference in project plans, reports, and technical documentation
· Provides an input to integrate cost and schedule data
· Ensures the alignment with the contracting execution strategy
· Facilitates the roll up of cost, progress, and schedule performance information for reporting purposes.
All parties (the Asset Owner, the EPC service provider and other service providers) involved in the project should comply with the WBS and related coding system. Clear and effective communication between the Asset Owner, the EPC service provider and other service providers (and in general, all third parties involved in the project), and constant monitoring of the construction work progress according to the WBS, are key to ensuring full alignment on scope of work, objectives, deliverables, and timing.
WBS’s lowest hierarchical items are the work packages (WP). By defining each WP in detail and considering dependencies, the project plan is created. Each WP should contain at least the following information:
· Name
· Unique number/code
· Version and status information
· Description of content and results to be obtained
· Prerequisites and dependencies (deliverables required etc.)
· Projected duration
· Resource requirements (people, material, tools, vehicles, etc.)
· Person responsible for the WP
A detailed scheduling of the activities, including milestones, is essential to completing the work in a timely manner. Proper scheduling of the works is mandatory for correctly managing and controlling the progress of the project. If the work plan has not been prepared appropriately, mistakes and delays cannot be identified, and corrections cannot be implemented. Furthermore, the project plan needs to be updated regularly.
Project managers derive subordinate plans and documents from the central project plan. For example, the EPC service provider and other service providers will have planning, scheduling, reporting, and documentation obligations, according to the stipulated contract. With reference to the WBS, contractors should be responsible for the lower-level activities schedules and plans. A typical document for this phase is the mobilisation plan, which includes:
· Construction site organisation chart: the subcontractors (civil and electro-mechanical) need to provide the construction site organisation chart which indicates all the expected positions, the staff residence times and the expected hours.
· List of site vehicles and equipment: subcontractors must provide the list of vehicles and equipment they intend to use for different kinds of work, accompanied by certificates of suitability and maintenance and/or testing sheets.
Work plan and mobilisation plan guarantee in-time arrival and accommodation of construction site personnel and assembly materials. They also ensure that the different elements of the construction phase are properly coordinated.
Based on the defined project schedule (baseline), the associated physical progress curve should be determined, to establish a reference plan for the percentage of physical completion of the project at each date. This is key for proper project monitoring.
To calculate the project’s physical progress, one must define specific calculation rules to apply to each elementary activity type, as well as determine the weighting criteria.
The construction plan should also define processes and procedures relating to the interface of the construction team with the rest of the project staff, in particular with the engineering, EHS and quality management teams. It should be assured, for example, that all the project changes proposed by the EPC service provider and other service providers are checked and approved by engineering department (change management). Furthermore, the construction activities should be verified in accordance with the quality control plan and HSSE procedures (quality management). Other control activities concern cost/budget, HSSE compliance, documentation, etc.
Check and finalisation of working permits
Country-specific legislation and regulations around HSSE and construction activities are continuously evolving. It is critical to be sure that all works, administrative permits, and authorisations have been obtained to avoid breach of any legal provision. Such a breach could result in severe consequences, both in terms of personal and administrative sanctions and in downtime and delay in the execution of the activities.
A useful tool to ensure full compliance is the prescription and authorisation checklist which should identify all the relevant legislation and regulations applicable to the specific project and location. It also lists all requisites necessary to start the construction activities (authorisations, particular training requirements for certain works, such as works at height, land lease agreements, etc).
Activation of external suppliers (services and materials)
Once all preliminary activities have been assessed and completed, the construction activities are ready to start. All subcontractors and suppliers must be activated according to the specific clauses of the relevant contracts and based on the scheduled activities. The scope of this phase is to ensure that all resources are present at the site in a timely manner to avoid any downtime and delay.
Construction implementation phase
Construction site activities must be supervised by the EPC service provider’s Construction Manager. They should coordinate with the Asset Owner’s Construction Manager and the Construction Supervisor on the monitoring and control of subcontractors. Throughout construction, drone construction monitoring flights should be carried out periodically to monitor, record and report on construction progress and quality. The data from these scans can also provide valuable support to H&S, stock management, and adherence to local planning and environmental regulations.
Construction site organisation
Construction site organisation refers to the preparation of the site for the start of civil, mechanical, and electrical works.
The effective mobilisation of the EPC service provider and related subcontractors usually takes place approximately 60 days from the signature of the contract. However, preliminary site preparation and executive engineering may begin immediately after signing.
In the mobilisation phase, contractors will begin to mobilise direct and indirect labour, equipment and means so that all planned activities can start as scheduled.
Site preparation main activities are:
· Opening of the construction site
· Archaeological survey may be requested by local authorities depending on the historical interest of the site
· Removal of vegetation removal and the superficial part of soil where foreseen (this kind of activity should be minimal in accordance with a positive biodiversity strategy)
· Staking and beating of the poles of the structures
· Visual mitigation works planned.
Civil works
Civil works refers to excavation for the construction of cable ducts, including foundation, MV overhead line supports, preparation of the areas where inverters and DC boxes will be installed, distribution station, road construction, and any earthworks in general.
They must be planned and implemented to minimise the interference and the overlap with the electro-mechanical activities described below, which are often difficult to manage from a safety point of view.
Biodiversity issues need to be considered to minimise the impact of civil works. Where this is not possible, restoration or compensation measures should be taken, but it is always better to reduce destruction during works. Raising the awareness of personnel and clear guidelines can help to achieve this.
Electro-mechanical works
Mechanical activities mainly consist of:
· Withdrawal of materials from the Contractor warehouse
· Assembly of metal structures
· Installation of PV equipment / panels
· Package / cabin assembly
· Tests and inspections
Electrical activities mainly consist of:
· Laying ground network (equipotential bonding)
· Laying DC (LV) solar cabling and related components for connecting PV module strings to inverters using tools certified/qualified by the manufacturer for PV cable-connectors assembly. At present DC cabling configurations can vary a lot but nevertheless, laying DC cabling is a key element of the electrical works
· Laying MV cables from transformer stations to the distribution station
· Laying LV auxiliary cables
· Cabin and field connections
· Tests and inspections
Ancillary works
Ancillary works are activities that are not directly connected with the assembly of the “electric generation plant”. They refer in general to security (fencing, CCTV, lighting, …), vegetation care, internal roads, signposting, and so on and so forth.
These works, even if not prioritised, must not be underestimated because they could delay the handover of the entire plant.
Grid connection
Utility scale PV plants need to be connected to the network, usually managed by the Transmission System Operator (TSO). Connection complexity depends on the distance between the plant and the substation, its conditions and the technical solution identified for the connections. These works are the final stage of the construction activities and normally require the involvement of the TSO, which should be scheduled well in advance.
Checks and functional tests
Once the plant is completely built and connected to the grid, one must test that it works properly. It is important that tests are carried out according to a detailed procedure agreed between the EPC service provider and the Asset Owner.
To this end, the EPC service provider must send the Asset Owner a detailed plan of execution of all the work necessary to reach Start-up (Start-up Plan), before the start of the Mechanical Completion and Pre-Commissioning activities of the plant.
The plan should include the following minimum requirements:
· Definition of a start-up team
· Definition of the project functional units and related sub-units
· Definition of the plant sections that can be put into production in sequence
· Definition of the schedule and procedures for carrying out the preparatory tests for the start-up for each functional unit and plant section
· Description of how to perform the Mechanical Completion and Pre-Commissioning tests on the functional units
· Description of the execution of the Commissioning tests on the functional units and on the entire system
Mechanical completion
When the plant is completely built and connected to the grid, after a visual inspection, the Asset Owner issues the Mechanical Completion Certificate (MCC).
The aim of the visual inspection is to verify:
· That all components and materials are present and in accordance with the project documentation
· The compliance of the completed project with the project documentation, the Technical Specification, and the current legislation
· The electro-mechanical completion of the plant
· That all components are free of visible damages that could compromise the safety of the components and personnel
· That the components have been installed correctly
· The correct identification and labelling of all components such as inverters, DC boxes, cables, support structure rows, switches, communication devices, monitoring elements, etc.
· The correct execution of the connections
· An aerial survey to validate the asset against its design layout
Training of Asset Owner and O&M service provider
As soon as the plant is ready for operation, after MCC has been issued, the EPC service provider should arrange for a specific training for the Asset Owner and the O&M service provider’s personnel (that could be a third-party or the O&M division of the EPC service provider). This training can transfer the knowledge and philosophy with which the plant has been designed and constructed.
Training is important as it allow the O&M service provider’s staff to familiarise themselves with the plant and its operations. Poor training standards can result in lower performance of the plant, due to delays in detecting system malfunction signals, resulting in longer downtime as faults are resolved. This is also an opportunity for the O&M service provider to give feedback to the construction (and engineering) team, especially if both belong to the same company.
The Asset Owner’s personnel should also receive training. This will help avoid misunderstandings between the Owner and O&M service provider and make their collaboration more efficient and effective.
A comprehensive and detailed as-built documentation (Annex E), manuals and procedures (Annex C “Documentation set accompanying the solar PV plant” of the O&M Best Practice Guidelines) should be part of the training activities. For more information on the handover to a specialised O&M service provider, please refer to Chapter 10 on Handover to O&M.
B. System Commissioning
System commissioning is one of the most important stages of the EPC service provider’s work as it closes the construction period and prepares the PV plant for commercial operation. This crucial step of the project includes performance and reliability tests. These make sure that the PV plant is built according to the international standards and industry best practices, and that it complies with the requirements as agreed with the Owner, grid specifications and guaranteed performance levels. Tests are undertaken for all individual components from checking that components function to more detailed measurements and verifications of the overall system. Successful commissioning and timely achievement of the Commercial Operation Date (COD) is linked to the release of a milestone payment as defined in the contract as well as the release of the performance bond. It is, therefore, very important that the contract clearly describes the requirements, criteria, documentation, and reporting required to complete the EPC service provider’s scope of work and handover to the Asset Owner and the O&M service provider’s team.
Pre-commissioning
Mechanical completion happens the final construction stage meaning that all principal components that are part of the PV plant have been erected or installed. At this point, the EPC service provider will usually conduct a detailed inspection of the works, possibly accompanied by the Owner or any third-party representative (such as a technical advisor). This option should be clearly stated in the EPC contract clause referring to commissioning (if the Owner intends to apply it). Activities carried out under pre-commissioning should be detailed and agreed in advance with the Asset Owner in a specific document.
The pre-commissioning activities fall within the construction phase and are mostly undertaken in parallel to the last steps of electro-mechanical works. In large scale projects, the first blocs are ready under pre-commissioning while other parts are still being erected.
The pre-commissioning phase includes the following main activities:
· Systematic compliance checks performed on each component of each system, performed in a non-energised state
Testing of appliances, energisation of cables, testing of instrumental circuits, testing of circuit breakers, etc During the pre-commissioning phase, the following tests should be performed, as a minimum requirement:
· Mechanical integrity of the modules with visual inspection and the correct wiring. Thermographic analysis (via drones) can be added at this stage as a best practice
· Verification of the nominal power of the installed system carried out as the sum of the nominal power at STC of all the installed modules
· Verification of the correct operation of all auxiliary services (fire system, rodent protection, forced ventilation of transformers, temperature sensors, UPS systems and related storage systems, lighting systems, etc.)
· Control of all input signals to the SCADA system
· Verification of all power supplies of the auxiliary services of the cabins
· Commissioning of UPS systems and related storage systems, SCADA system and of weather stations and environmental sensors
· Verification of IP addresses on all equipment
· Setting of all alarm thresholds on the equipment
· Verification of the correct polarity and electrical continuity of all the strings
· Check all electrical connections
· Completion and functional verification of the earthing system.
After execution of pre-commissioning activities, the plant will be ready for energisation and for the commissioning activities.
Usually, a detailed checklist covering all components and parts is used to make sure that nothing is missing or incomplete. The works are thoroughly checked through the following items:
· Inverters
· Modules
· Foundations
· PV Module Mounting Structures
· LV and MV Cabling
· Transformers
· Protection, distribution centres and switch gear at the substation
· Combiner boxes
· Civil works
· Low and medium voltage installation works
· Monitoring and security systems
Finally, the checklist should be provided to the Owner and their advisors, together with the compilation of an initial list of construction defects (commonly referred to as a “punch list” or “snagging list”). Counterchecking the EPC service provider checklist and providing own observations and items to add, as defined by the Owner or their advisors, is recommended. . This punch list should include only minor finishing works, the cost of which usually equates to a small percentage of the overall contract value. The contract also needs to specify the timeframe for correcting punch list items, and what the conditions are for granting Provisional Acceptance if punch list items remain unfinished. Once the punch list has been issued by the Owner’s representative a meeting is required between them and the EPC service provider to agree specific resolution for each item and determining if any items are disputed.
Mechanical completion allows for further testing activities to commence. In large scale projects, this is often undertaken by batch and delayed over time, as different parts of the plant are in different stages of construction.
Commissioning, off-grid, and on-grid tests
Commissioning activities
Commissioning activities include operational checks and tests executed on energised electrical systems. The Test Protocol must be agreed between the parties before the start of the tests as part of a Start Up Plan, defined before the start of the Mechanical Completion and Pre-Commissioning activities.
The Test Protocol must respect all the requirements contained in the contract and its basic content should include:
· Results of the visual inspection and related checklist
· Test methodologies
· Instrumentation used for testing
· Test program
· Test conditions
· Test data
· Results of the Pre-Commissioning and Commissioning tests
· The start-up protocols issued for the key components (inverters, transformers, etc.)
This testing aims to verify and certify that the plant has been constructed professionally, according to the pre-established technical prescriptions, and in accordance with the project and any approved variants.
Before the plant is energised, a series of functional tests and measurements should be undertaken as per the reference norm IEC 62446: Grid connected photovoltaic systems. Minimum requirements for system documentation, commissioning tests and inspection for all electrical commissioning.
The testing procedure should be handed over to the Owner prior to commencing the tests, as is usually defined in the EPC contract. This allows the Owner or advisors to review and comment on the testing procedure before implementation. At the end of the commissioning phase, the EPC service provider submits a Test Protocol to the Asset Owner, summarising the results of the Pre-Commissioning and Commissioning tests.
The following test regime shall be performed on all systems. Any test indicating a fault should lead to default rectification and re-testing of the components.
On the AC side, all AC circuits, including AC cables from inverters to transformers, transformers themselves, and main MV switchgear should be tested according to the requirements of IEC 60364-6.
On the DC side, the following tests shall be carried out on the DC circuits and components forming the PV array:
· Continuity of earthing and/or equipotential bonding conductors, where fitted
· Polarity test
· Combiner box test
· String open circuit voltage test
· String circuit current test (short circuit or operational)
· Functional tests
· Insulation resistance of the DC circuits
Some expanded test, not mandatory but often included in the EPC service provider contractor scope, can also be carried out to ensure the best system performance and reliability:
· String I-V curve measurements on a selected sample (10% of the plant at 500W/m²)
It is a best practice to take a pragmatic approach to tests which require minimum levels of irradiance. String tests and thermography should be carried out above certain irradiance minimums. Conducting them at lower levels will provide reduced value from the results. If necessary, some tests may need to be deferred until high season to be valid.
In addition to the above electrical tests, all other equipment should be tested according to the manufacturer’s guidelines and industry best practices to ensure that it functions properly before the energisation of the PV plant. All other equipment and materials include:
· Meteorological stations and monitoring system
· Low voltage installation, civil works, and medium voltage installation
· Security system as well as cyber-security system
· Sanitary system
· Firefighting system
Off-grid testing
The first tests to be conducted are the polarity and combiner tests which need to be undertaken while all strings are still disconnected.
The off-grid tests should include measuring 100% of the open circuit voltage (Voc) and the short circuit current (Isc) of the module strings according to IEC 62446. Prior to starting testing, the Owner must confirm the adequacy of the measurement devices to be used by the EPC service provider (measurement uncertainty, calibration, etc.). A report with measurement results from all the strings will be presented by the EPC service provider in digital form, as an Excel file.
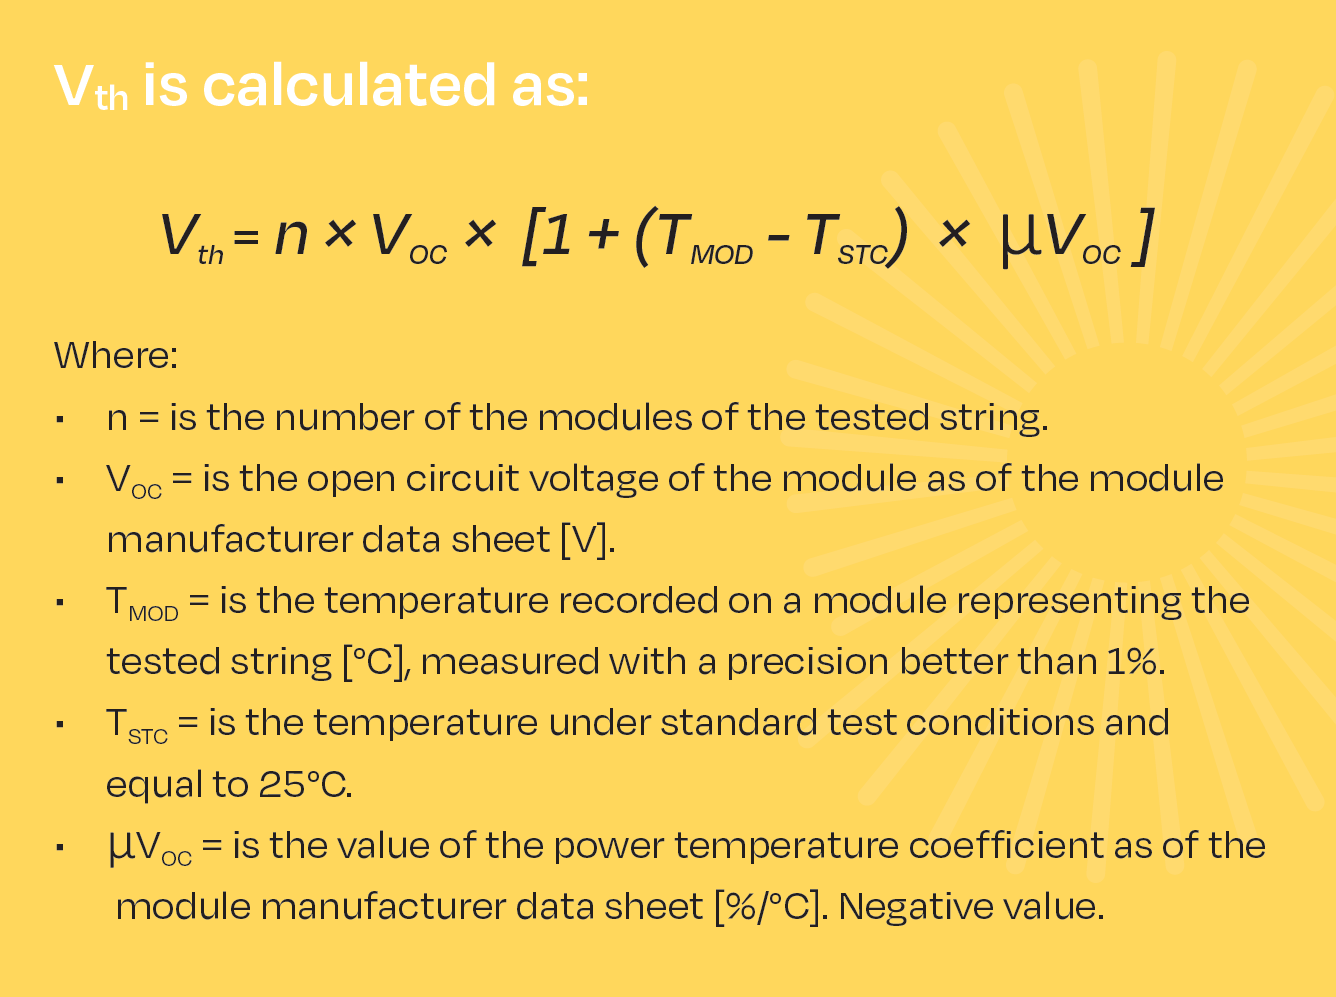
The VOC test is passed if all the VOC, string on the tested strings is within 5% of the expected value derived from the module datasheet. Note that most of the time, the theoretical value should be adjusted with the actual temperature recorded at the time of the measurements as it may be far from STC (25°C).
A commonly used formula is:

Where Vth is the theoretical open circuit voltage for the strings and calculated as follows:
The Isc test is passed if all the Isc,string on the tested strings satisfy the following condition:
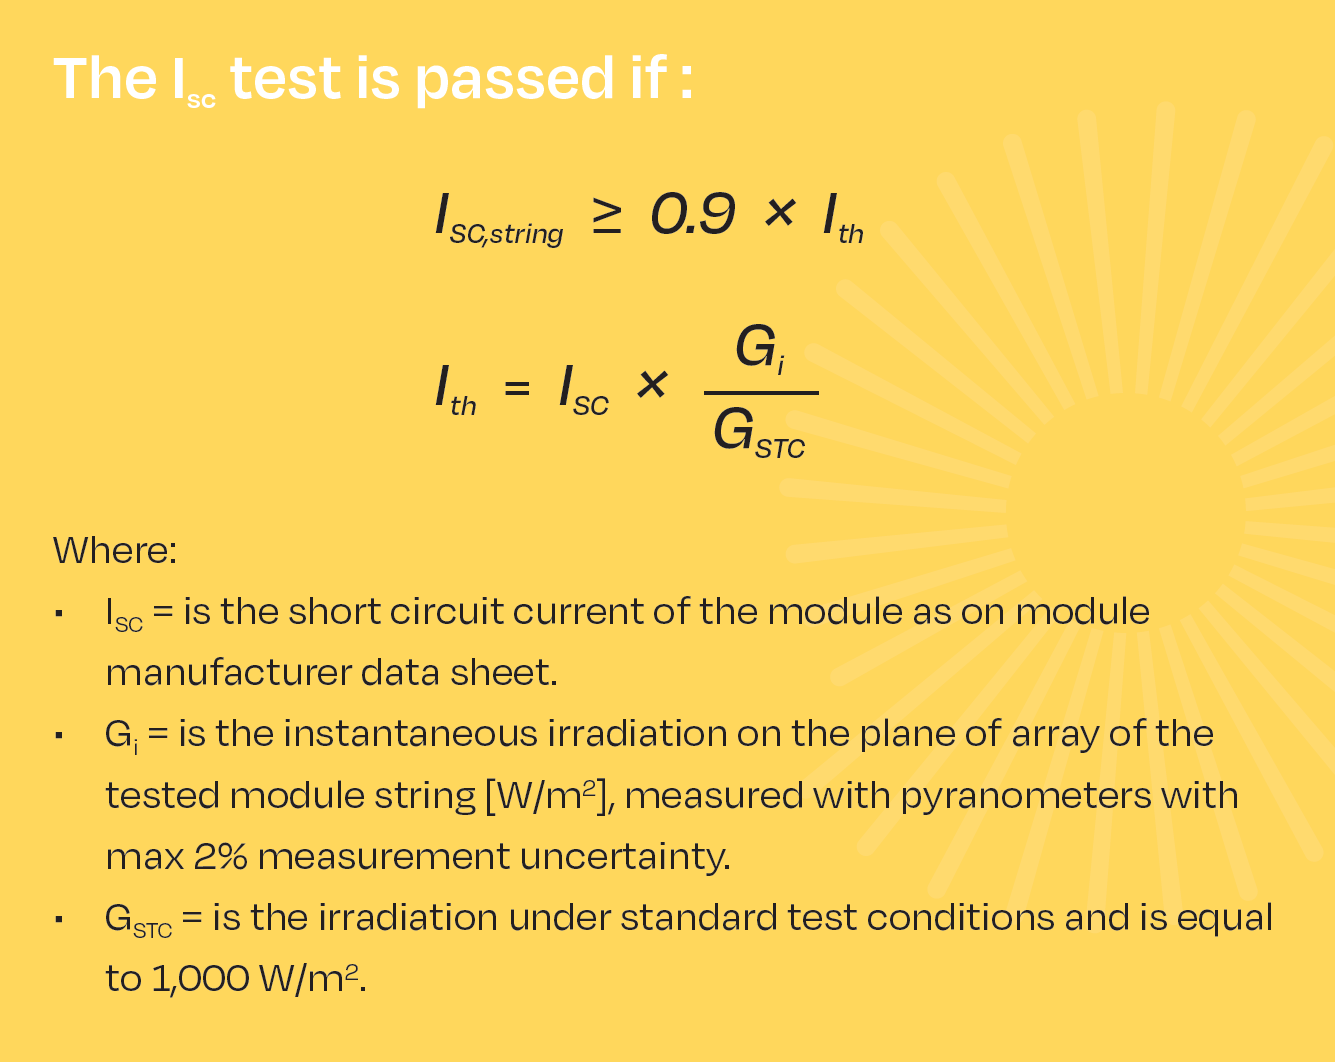
It should be noted that the short circuit current test is not intended to detect system underperformance but only used for fault detection in string cabling.
Once the commissioning phase of all the plant sections has been completed and the protocol test issued, the Ready For Start Up (RFSU) certificate of the plant is released by the Asset Owner and then the On-Grid performance and functional tests can be started.
On-grid testing
Once the above off-grid tests have been successfully performed, the PV plant can be energised at inverter level and main switchgear level at the point of interconnection with the grid. The EPC service provider shall demonstrate that the overall system and equipment operates in accordance with the:
· Equipment manufacturer specifications especially for inverters, transformers and MV equipment
· Grid Connection Agreement which should be annexed to the EPC contract, or at least its technical annexes regarding testing and commissioning specifications
· Specifications set out in the EPC Contract
· Any relevant Applicable Standard, mainly IEC 61727 and local grid code
Inverters and transformers shall be commissioned by their manufacturer or an authorised representative of the manufacturer, using the manufacturer’s specified procedures. Commissioning reports shall be issued in a format provided by the manufacturer.
All SCADA system equipment shall be commissioned and tested using the manufacturer’s specified procedures. Tests shall verify the correct operation of the SCADA system, meters, sensors, weather station instruments, and all inverters, while verifying the correct data input logging from trackers (if any), breakers, and other components monitored by the system. The SCADA system shall be fully remotely accessible. A SCADA system commissioning protocol or report shall be provided.
Before energisation, the EPC service provider shall verify the completeness of the substation and the correct installation of all components. A detailed inspection of the substation shall be executed. The testing and commissioning of the PV plant substation connection to the grid system should be performed, including but not limited to:
· MV equipment
· Control and Monitoring System
· Protection system
· Telecommunication system
· Metering devices
· Auxiliary supply equipment and back-up (UPS, diesel, etc.)
In some countries, compliance with the grid code and local safety standards need to be validated by an independent body, and a certificate provided to the grid operator to allow power injection. These compliance tests may also be carried out by the grid operator themselves.
Prior to achieving Provisional Acceptance, it is common practice to carry out module thermography, using aerial inspections as best practice. 100% module thermography should be carried out at this stage according to IEC 62446-3:2017. Issues identified from this inspection will need to be resolved to pass PAC. These inspections and the reports generated should form part of the handover documentation.
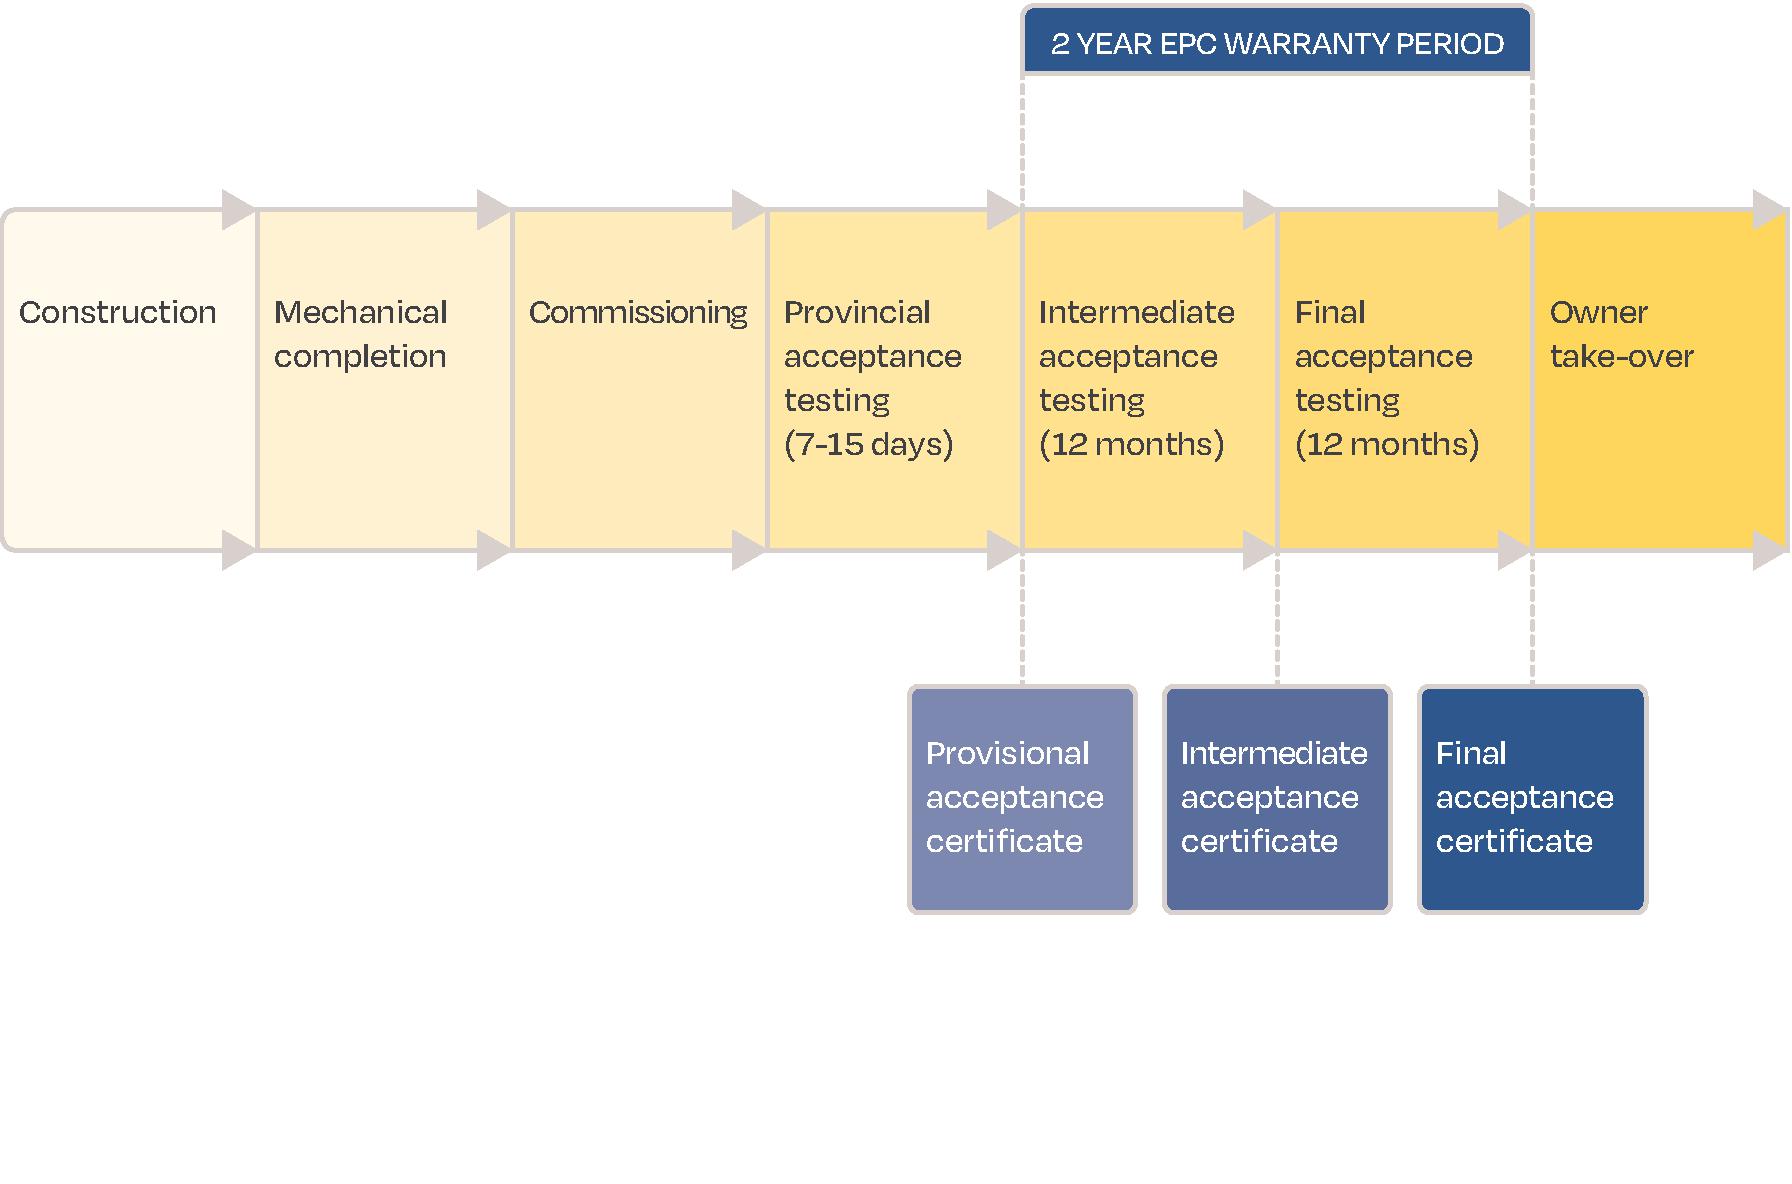
Provisional Acceptance Certificate
The Provisional Acceptance stage marks the end of the construction works and obligations of the EPC service provider. It means the Asset Owner is giving their conditional acceptance of the works. This triggers the two-year standard warranty period, across which the EPC service provider must prove a minimum level of performance from the PV plant, as defined in the contract. At this stage, the plant is also handed over to the Owner and the O&M service provider which may be the same company as the EPC service provider or a third-party.
The conditions for issuing the PAC may differ from contract to contract but the key elements are as follows:
· All commission tests have been successfully completed, including Mechanical Completion, grid connection and energisation of the plant
· The noncritical punch list items have been identified and signature have been provided for corrections. The value of this remaining work does not exceed a certain proportion of the contract price (typically 2-5%)
· The Provisional Acceptance performance tests have been passed (PR but also functional and capacity tests in some cases)
· All equipment and sub-contractor warranties are transferred to the Owner
· The EPC service provider has provided the Owner with the initial or minimum stock of spare parts, as defined in the contract
· All as-built documentation has been provided to the Owner
· Training of the O&M service provider’s teams has been performed and relevant O&M manuals issued
· Liquidated damages (LDs) related to performance or delays have been paid by the EPC service provider
· Any performance security or warranty bond required during the EPC warranty period has been delivered to the Owner
The PAC is signed off by the Asset Owner and, if stipulated in the contract, can also be validated and signed by an independent advisor.
Performance Ratio test
After the functional test, the PV system’s performance, in terms of energy and power, is evaluated in the Start-Up phase. To validate the PV plant performance at Provisional Acceptance phase, the PR test is conducted over a limited period and compared to the guaranteed PR, set based on simulations. The usual duration of PR tests is 7 to 15 days, depending on the contract. From an Owner’s perspective, having the longest testing period possible is recommended, as this helps to check performance in a wide range of climatic conditions, and facilitates comparisons with simulated values.
Usually, the testing period needs to fulfil minimum requirements regarding weather conditions and plant availability such as:
· Minimum irradiance threshold in daily values on a certain number of days (e.g., 8 days over a 15-day period with irradiance greater than 5kWh/m²/day) which should be adapted depending on the season of the test and specific conditions of the project location
· Minimum irradiance threshold on a single day for consecutive hours (e.g., irradiance over 500W/m² during at least 3 consecutive hours in 8 days over a 15-day testing period), also to be adapted to the season and project location
· Total number of testing hours with irradiance above a certain threshold (e.g., 500W/m² for at least 20 hours in a 15-day period)
· Availability should be 100% during the testing period at least at inverter level. Grid availability should also be 100%. The SCADA and the environmental monitoring system must also guarantee 100% availability of data throughout the test period
If the above conditions are not fulfilled within the testing period, it is generally extended until they are. Conditions should be set pragmatically and potentially adjusted to avoid delaying the PAC and leading to difficult negotiations and distrust between parties. The time of year should be considered so that unrealistic thresholds are avoided. The performance tests should ideally be performed during spring as this is usually when performance is at its peak due to better weather conditions. Poor weather conditions can penalise performance compared to simulated values (high summer temperatures, winter shadows or low irradiance).
If the continuity of the test is interrupted due to faults or events related to the malfunction of the plant or one of its parts, the test will be suspended and repeated from the beginning.
If the causes of the interruption are not attributable to the EPC service provider, the test will be suspended and will resume at the end of the interruption.
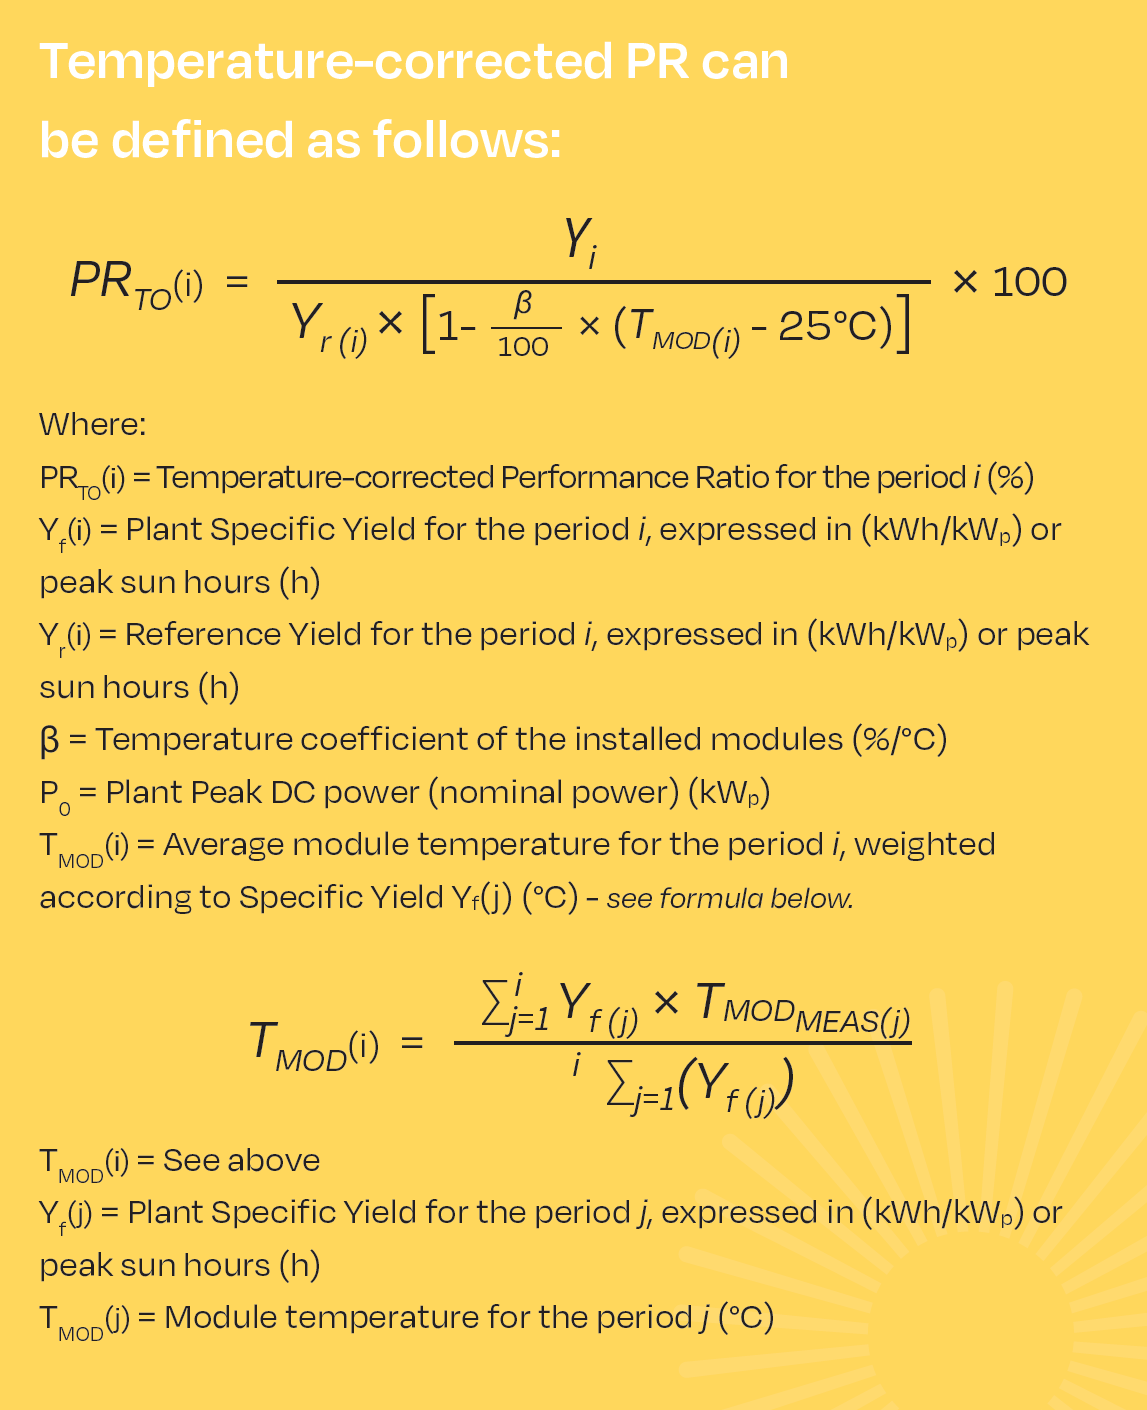
The PR calculations are based on the mathematical definition formula, but each parameter can differ and have its own specifications from contract to contract. It is important to check the consistency of the formula and the input values definitions and measurement rules.

These definitions are based on (Woyte et al. 2014) in line with IEC 61724-1:2017 and are common practice.
For projects located in regions with high temperatures and temperature variability, a temperature-corrected PR methodology needs to be implemented to account for the weather effects.
Finally, the measured PR is compared to the guaranteed value based on the pre-construction yield assessment simulations. A buffer between the simulated value and the guaranteed one is generally used by the EPC service provider. It is important to ensure that the design reference yield has been updated to reflect any changes made during the project. More specifically, the internal and self-shading factor should be checked for accuracy. The guaranteed PR at Provisional Acceptance should be presented as a monthly breakdown of the yearly simulation to ensure accurate comparison with the measured PR for the testing period. Given the short duration of the test, guaranteed PR at Provisional Acceptance is only used as a validation criterion for the Owner’s “take over”. It does not usually trigger performance liquidated damages as they are linked to the results of annual PR tests. If PR is below the guaranteed threshold, corrective action might be undertaken, and testing should be repeated.
Once the PR criteria and any other requirements have been met, the PAC is issued. The project reaches the handover phase, which is the start of the operational phase and O&M activities.
Other tests
In some contracts, complementary tests can be performed at the Provisional Acceptance stage. These tests can reflect the requirements of the energy off taker with the Power Purchase Agreement (PPA), whether or not the system functions, or simply be used as additional quality assurance measures.
To prove the project’s ability to perform to its maximum capacity, a Reliability Test can be undertaken. This means the project must go a certain period (e.g., 7 consecutive days, or 100 consecutive hours) without significant system failure or malfunction. Furthermore, the project must prove that it can run for a certain amount of time without inverter failures or shutdowns, with full availability of AC and DC equipment, and less than a certain threshold (typically 2%) of string or tracking system failure (if any). If a system failure or malfunction occurs, corrective action shall be taken by the EPC service provider and the Reliability Test is restarted the following day.
Additionally, a Capacity Test may be required to prove that the installed capacity can reach the level promised to the off taker. This is usually based on the DC capacity of the plant, calculated based on the peak powers of the installed PV modules, as stated on the manufacturer’s data sheets. Alternatively, this is calculated from the sum of the peak powers of the Flash Test of the PV modules, provided by the manufacturer at shipment. These values must be signed off by an independent third-party.
Start of plant commercial operation
Once all performance tests described in the above sections have been completed, the Asset Owner issues the PAC and commercial production starts (Commercial Operation Date).
To ensure a smooth and efficient handover to operation activities, the Asset Owner should be involved well in advance and participate in the commissioning phase and performance tests. It is also a best practice to involve the operations function of the Asset Owner during the development and engineering phase, so that an O&M perspective can also be taken into consideration.
Comprehensive and detailed as-built documentations (Annex E of the O&M Best Practice Guidelines), manuals and procedures (Annex C “Documentation set accompanying the solar PV plant” of the O&M Best Practice Guidelines) should be part of the training activities. For more information on the Handover to a specialised O&M service provider, please refer to Chapter 10 onHandover to O&M.
Intermediate and Final Acceptance Certificate
There is a standard duration of 24 months (depending on the EPC contract) between the start of the Taking-Over phase to the Defects Notification Period. The EPC service provider is usually responsible for O&M and rectifying any defects that may be identified during this period. However, this may vary from market to market. During this period, a performance warranty based on a guaranteed PR is still in place and can be reviewed on a yearly basis. Annual PR tests are crucial for checking the PV plant performance, as they do not include seasonal bias. For smaller scale projects, this Defects Notification Period can be reduced to 12 months. It is always recommended to carry out PR verifications for at least one full year.
The calculation methodology is different to Provisional Acceptance and should be based on long-term PR tests. The guaranteed performance ratio should be adjusted to account for module degradation over the first and second years of operations. Should the measured PR be above the expected threshold of guaranteed value, then Intermediate and Final Acceptance certificates are issued accordingly. The Owner can then issue a performance certificate and release the performance warranty bond of the EPC service provider. This performance certificate constitutes the full acceptance of the PV plant by the Owner and the release of the Contractor’s obligations.
The guaranteed PR (and therefore the guaranteed energy) takes into account any event causing non-production due to periods of plant downtime. Owner and EPC service provider may agree, and provide for this in the EPC contract, not considering certain special events. In general, it is reasonable to exclude certain events that are outside the control of the EPC service provider (e.g., vandalism, plant stop imposed by the Transmission System Operator) and Force Majeure events.
The EPC contract shall include provisions on how to deal with cases where actual performance is lower than guaranteed performance. These provisions in general are included in the penalty clause.
Where actual performance is lower than guaranteed performance, EPC service provider shall:
· Make all interventions necessary to ensure that guaranteed process parameters are achieved
· Liquidate both the production lost (difference between actual and theoretical production during the period from PAC to the Final Acceptance Test) and the estimate of the lost production expected for the remaining useful life of the plant.
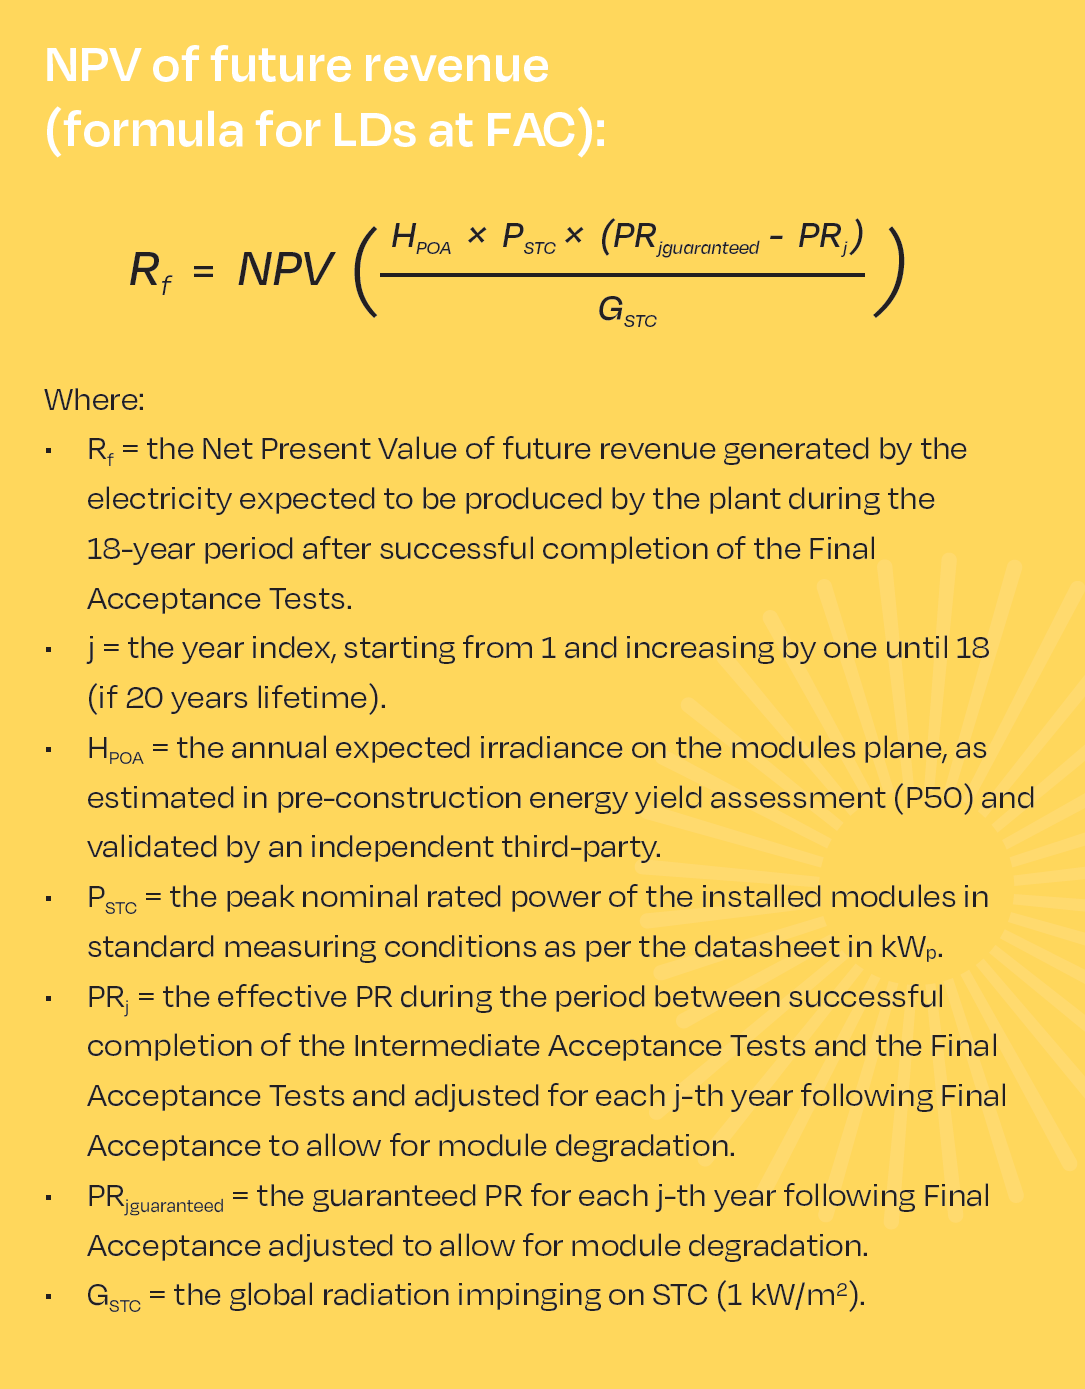
If the measured PR is below the guaranteed levels, the EPC service provider is required to pay performance Liquidates Damages (LDs) up to a certain amount to the Owner for the compensation of revenue losses. During the Intermediate Acceptance phase, the LDs are based on the annual production shortfall and the electricity selling price of the PV plant. During the Final Acceptance phase, the LDs are also calibrated to reflect the loss of revenues that are expected for the full project lifetime or duration of the Power Purchase Agreement. This is usually calculated as the Net Present Value of future revenues shortfall linked to the PR shortfall. Below is an example formula for additional LDs at Final Acceptance:
Other requirements at Final Acceptance stage should include an inspection of the whole plant, including the civil works, electrical infrastructure, every piece of equipment and device installed, and the auxiliary systems, to verify that the EPC service provider is leaving the plant in optimum condition. This should ideally be done in the presence of the Owner and an independent third-party (technical advisor). All existing defects must be solved as a condition for acquiring the Final Acceptance Certificate (FAC). Spare parts can also be replenished in accordance with the O&M contract requirements to ensure a smooth transition between both service providers. Additionally, further testing such as repeated module thermography, across all modules, should be performed as a best practice, preferably using aerial inspections during the period between PAC and FAC. This is to ensure that any issues identified can be resolved before the date for Final Acceptance. It will enable the identification of any early-stage degenerative issues. These activities can be included within the EPC service provider’s scope or under the responsibility of the Owner at their own costs.
After the Final Acceptance Test the Owner shall issue the FAC and shall take over the full responsibility of the plant.
Data and communications
Data and Monitoring Requirements
In general, monitoring systems should allow follow-up on the energy flows within a solar PV system. In principle, it reports on the parameters that determine the energy conversion chain. These parameters, along with the most important energy measures in terms of yields and losses, are illustrated in Figure 2. These yields and losses are always normalised to installed solar PV power at standard test conditions in kilowatt-peak (kWp) for ease of performance comparison.
All components and different aspects of technical data management and monitoring platforms are described in the following paragraphs. Reference should also be made to the Monitoring Checklist of the Solar Best Practices Mark for a synthesis of the most important best practices and recommendation with respect to these points.

Data loggers
The main purposes of a datalogger are:
· Collecting data of relevant components (inverters, meteorological data, energy meter, string combiners, status signals) with every device registered separately
· Basic alarm functionality (e.g., Field Communication issues, time critical events like AC Off)
· Providing a temporary data backup (in case of missing internet connection)
· Supporting the technicians during commissioning (e.g., checking whether all inverters work and feed-in)
In addition to this, some dataloggers can also provide the following functions:
· Power Plant Controller (Monitoring & Control should be managed by one instance to avoid communication issues regarding concurrent access). The Power Plant Controller can be integrated in the datalogger or can be a separate device using the communication channel of the datalogger or even a separate one with preferential bandwidth
· Solar Energy Trading Interface (control the active power by a third-party instance like energy trader)
As best practice, dataloggers should be selected following a list of criterion by the operating party as listed below. For example, an EPC service provider will choose and install the data logger used to monitor the site. This datalogger should be selected:
· for its compatibility with the inverters and auxiliary equipment present on site. Preference for inverter-agnostic dataloggers
· for any command functionality that may be needed (this is site type and country specific)
· for its connectivity strength to the internet
· for its robustness (longevity of life and durability for the environmental conditions it will be kept in)
· for its cyber security measures (and those of the cloud server to which it is connected), namely the possibility to set up a VPN tunnel at least
· for its capability to store data during internet communication outages
The recording interval (also called granularity) of the datalogging should range from 1 minute to 15 minutes. Within one monitoring environment granularity should be uniform for all the different data collected.
As a minimum requirement, data loggers should store at least one month of data. Historical data should be backed up constantly by sending it to external servers and, after every communication failure, the data logger should automatically send all pending information. Moreover, data transmission should be secure and encrypted. There should also be a logbook to track configuration changes (especially relevant when acting as Power Plant Controller).
As a best practice, the data logger should store a minimum of three months of data locally and a full data backup in the cloud. Moreover, the operation of the data logger itself should be monitored. This should be done remotely and from an independent server, delivering information on the data loggers’ operating status at Operating System (OS) and hardware level. It should also provide alerts to the Operations room in case of failures and communication loss.
Best practice is to have dataloggers and routers constantly monitored by a watchdog device on-site. In case of no response to the control unit, the power supply will be interrupted by the watchdog unit, performing a hard reset on the stopped equipment. In cases where it is not possible to have an external watchdog it can be useful to have an automatic reboot function.
The entire monitoring installation should be protected by an uninterruptable power supply (UPS). This includes data loggers, network switches, internet modems/routers, measurement devices and signal converters.
Data Quality & Curation
The main purpose of the monitoring system is to collect data from all the relevant components (energy meters, meteorological sensors, inverters, string combiner boxes, etc.) which are typically installed across the field and connected to the plant SCADA through the local network by using various technologies (serial links, cable, fiber, wireless, etc.). Moreover, renewable plants, and solar plants, are often situated in remote environments, and sometimes in harsh places. As such, equipment and systems are subject to difficult conditions and are often subject to data quality issues.
The data quality issues that equipment may face may be categorised as follow:
· False negative values
· Outliers
· Spikes
· Data gaps
· Junk values
These data quality issues can provoke situations that vary extremely depending on the plant, type of measurement, or systems in place. As such, it is very difficult to implement an overall and systematic data quality strategy for renewable Asset Owners as each case is unique.
The data quality issues mentioned above are obvious and may impact many KPIs which are calculated on this basis. More challenging to identify, are slight and progressive data deviations overtime.
Biased KPIs lead to unnecessary operations costs (unrequired on-site intervention) and performances losses, as defects may remain undetected.
As a best practice, the monitoring solution and system should be capable of filtering these values in the most automated and personalised way to cater for each specific case.
Most effective techniques for data validation are based on the analysis of data over relatively long timespans (i.e., daily data validation), with a granularity between 1 and 15 minutes.
Monitoring (web) portal
The main purposes of the monitoring portal are:
· Reading any type of raw data coming from any type of data logger or other solar PV platforms with no preference on brands or models
· Creating a long-term archive for all raw data provided by the asset
· Modelling each solar PV asset using all available information regarding the actual set up and devices (type of devices, installation/replacement date, modules-string-inverter system layout, modules inclination, orientation, type of installation etc.)
· Visualising aggregated data in the highest possible granularity (1 to 15 min is a best practice for most of the indicators)
· Visualising data in standard and specific diagrams
· Computing and visualising dashboards and views of KPIs. For the list of indicators to be computed, see Chapter 10. Indicators computational inputs might be selectable by the user
· Validating data quality (e.g., through calculation of data availability)
· Detecting malfunctions as well as long term degradations with customisable alarms
· Handling alerts from field devices like dataloggers or inverters
· Calculating typical KPIs (such as PR and Availability) with the possibility to adapt parameters
· Providing consistent and easy to use aggregated KPIs for customisable reports for single plants and portfolios
· Making data available via a standardised interface for use in other systems
The monitoring portal should fulfil the following minimum requirements:
· Accessibility level of at least 99% across the year
· Interface and/or apps dedicated to use cases (on-site service, investor etc)
· Customisable user Access Level
· Graphs of irradiation, energy production, performance, and yield
· Downloadable tables with all the registered figures
· Alarms register
As best practice, the following features will also be included in the Monitoring Portal:
· Configurable User Interface to adjust the views depending on the target group (e.g., O&M service provider, EPC service provider, Investor, Asset Manager)
· User configurable alarms
· User configurable reports
· Ticket system to handle alarm messages
· Plant specific KPIs
· Integrate Third Party Data (e.g., solar power forecast, meteorological data, satellite data for irradiance)
· Granularity of data should be adaptable for downloads of figures and tables
The above lists are not exhaustive. For a comprehensive overview of recommended functionalities, refer to the Monitoring Checklist of the Solar Best Practices Mark.
Data format
The data format of the recorded data files must respect standards such as IEC 61724 and must be clearly documented. Data loggers should collect all inverter alarms in accordance with original manufacturer’s format so that all available information is obtained.
Configuration
The configuration of the monitoring systems and data loggers needs to reflect the actual layout of plant details (hardware brand, model, installation details such as orientation, wiring losses, set up date, etc.) to better perform expected performances simulations and obtain consistent insight about a plant’s actual status. If this has not been done during the plant’s construction phase, it should be done at the commissioning phase or when a new O&M service provider takes over (recommissioning of the monitoring system).
During commissioning, each single piece equipment monitored should be checked to make sure it is properly labelled in the Monitoring System. This can be done by temporarily covering insolation sensors or switching off others such as string boxes or inverters.
It is best practice to have a Monitoring System capable of reading and recording all IDs from all sensors and equipment it monitors. This will reduce the possibility of mislabelling elements and improve the tracing of equipment and sensor replacement during the life of the facility. Some Monitoring Systems have even an auto-configuration feature (plug-and-play) that reduces start-up time and potential mistakes. This it is done by automatically capturing device IDs and configuration information. This also allows for automatic detection of inverter or sensor replacement.
Interoperability
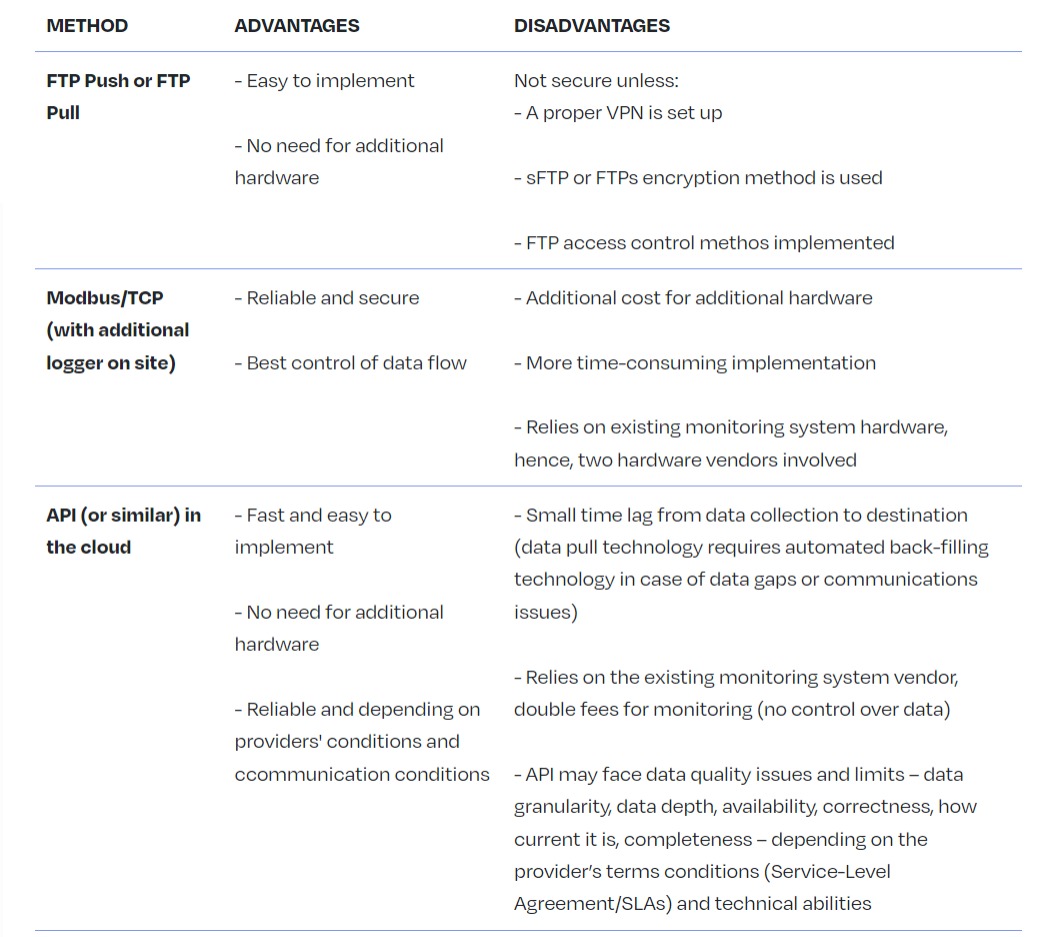
As a best practice, the system should ensure open data accessibility (both for sending and receiving data bilaterally) to enable easy transition and communication between monitoring platforms. Table 5 shows some examples of data integration options. Due to the lack of unifying standards, every Monitoring System provider has their own method of storing and retrieving data. The best systems can retrieve data by using open interfaces such as RESTful, providing interoperability between different systems.
Another important aspect of interoperability is the ability to aggregate data from different platforms that serve a range of areas in the solar PV business, such as administration, accountancy, planning & on-site intervention, and stock management applications. This way, information can be exploited by the central monitoring platform without affecting the external applications. For example, an O&M service provider works with several types of ticketing systems for different clients. The monitoring platform should be able to collect data from all of them. Likewise, information about tickets managed from the central monitoring system should be automatically transferable to the dedicated ticketing application.
Internet connection and Local Area Network
The O&M service provider should make sure to provide the best possible network connectivity. As a minimum requirement, the bandwidth needs to be adequate enough to transfer data in a regular way.
Whenever a fibre connection is available within the solar PV-site area, this should be used to connect to the internet, with industrial routers considered as standard. Where a fibre connection is unavailable, 4G or Wi-Fi communication is preferred. Satellite connection is the least preferred communication type. An additional back-up system is best practice. Any subscription should allow for the data quantity required and should foresee the amount (e.g., Closed-Circuit Television (CCTV) or not)granularity of the data.
For solar PV power plants larger than 1MW it is advised to have a WAN connection and as an alternative to an industrial router, that allows for mobile or satellite communication back-up in case the WAN connection fails. A system with a reset capability in case of loss of internet connection is recommended. A direct connection to a monitoring server with an SLA guarantees continuous data access. If data passes via alternative monitoring servers without an SLA, (e.g., monitoring portal of the inverter manufacturer), the SLA can no longer be guaranteed. The automatic firmware updates of the data logger should be disabled. Firmware updates are subject to a change management procedure with the monitoring service.
All communication cables must be shielded. Physical distances between (DC or AC) power cables and communication cables should be ensured, and communication cables should be shielded from direct sunlight. Furthermore, cables with different polarities must be clearly distinguishable (label or colour) for avoiding polarity connection errors.
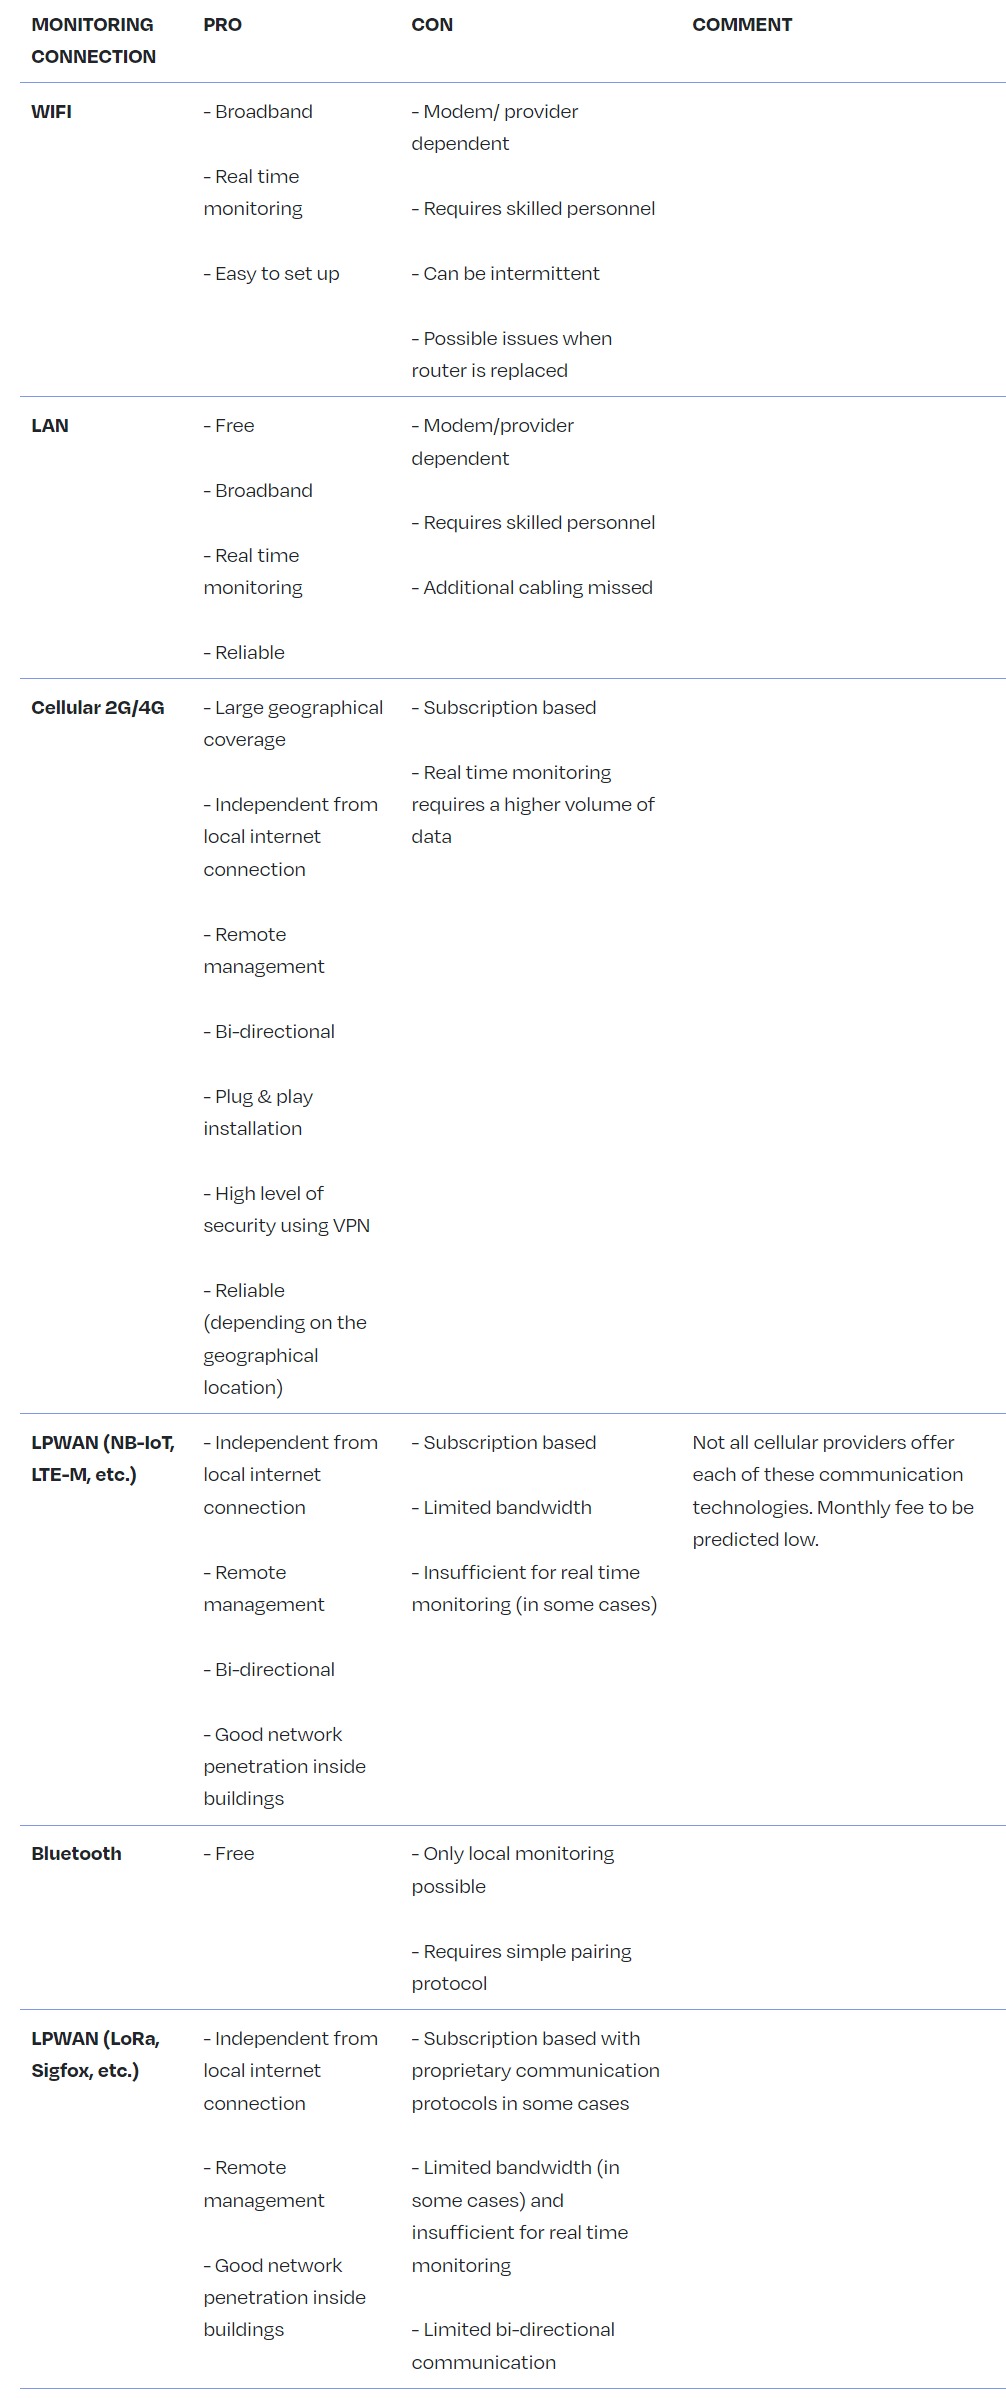
Pros and cons of different types of monitoring connections:
Data ownership and privacy
The data from the monitoring system and data loggers, even if hosted in the cloud, should always be owned by and accessible to the Asset Owner (or SPV). Stakeholders such as the O&M service provider and the Asset Manager need the data to perform their duties and should be granted access. In addition to this, auditors working in the due diligence phases of a project should also have access. It is important to have at least two access levels (read-only, full access).
The monitoring system hardware can be provided by the O&M service provider or a third-party monitoring service provider (but the monitoring system hardware remains the property of the Asset Owner as part of the installation):
· If the O&M service provider is the monitoring service provider, they have full responsibility for protecting and maintaining the data, and ensuring the proper functioning of the monitoring system.
· Where there is a third-party monitoring service provider, responsibility for protecting and maintaining the data resides with them. The O&M service provider should endeavours to make sure performance monitoring is correct and takes the best practices mentioned in the previous paragraphs into consideration. The O&M service provider’s ability to properly maintain and use the monitoring system should be evaluated. If necessary, the O&M service provider should be appropriately trained to use the monitoring system. Data use by third-party monitoring providers should be extremely limited, i.e., for correcting bugs and developing additional functions to their systems.
Cybersecurity
As solar PV power plants have inverters and power plant controllers (and monitoring systems) that are connected to the internet to enable surveillance and remote instructions by operators, there are significant cybersecurity risks.
Cybersecurity comprises technologies, processes and controls that are designed to protect systems, networks, and data from cyber-attacks. Effective cyber security reduces the risk of cyber-attacks and protects organisations and individuals from the unauthorised exploitation of systems, networks, and technologies.
Cybersecurity is a vast area and multiple measures are possible. The following hints may help as a starting point:
· Keep it simple: If possible, reduce the type of network devices to a minimum
· As a recommendation, traffic of the network devices may be monitored to detect abnormally high use of bandwidth
· Secure physical access to the network devices and implement a secure password policy. Avoid the use of standard passwords and change all factory setting passwords
· Control access from Internet via strict firewall rules:
- Port forwarding should not be used because this is a big security gap. Only router ports that are necessary should be opened
- Reduce remote access to the necessary use cases
- The use of VPNs (Virtual Private Networks – a secure connection built up from the inside of the private network) is necessary
- VPN access to the site from outside is a minimum requirement
- A VPN server or VPN service which works without requiring a public IP on-site is preferred
- Each solar PV power plant should have different passwords
- Keep your documentation up to date to be sure that no device has been forgotten
- Use different roles to the extent possible (e.g., read only user, administration access)
- Use professional (industrial grade) hardware; only this hardware provides the security and administration functions your plant needs to be secure
· Implement vulnerability management (i.e., identifying and fixing or mitigating vulnerabilities, especially in software and firmware):
- Improve insecure software configurations
- The firmware and software of devices should be kept up to date
- Use anti-virus software if possible and keep it up to date
- Avoid wireless access if it is not necessary
- Audit your network with the help of external experts (penetration tests)
· Keep your company safe:
- Do not store passwords in plain text format, use password manager (e.g., 1Password, Keepass, etc.)
- Train your employees on IT security awareness
- Do not share access from all plants to all employees. Give access only to those who need it. This way damage can be limited if an individual employee is hacked
- Management of leaving and moving employees; change passwords of plants which are overseen by an employee who has left the company or moved to another department
It is therefore best practice that installations undertake a cyber security analysis, starting from a risk assessment (including analysis at the level of the system architecture) and implement a cybersecurity management system (CSMS) that incorporates a plan-do-check-act cycle. The CSMS should start from a cybersecurity policy, and definition of formal cybersecurity roles and responsibilities, and proceed to map this onto the system architecture in terms of detailed countermeasures applied at identified points (e.g., via analysis of the system in terms of zones and conduits). These will include the use of technical countermeasures such as firewalls, encrypted interfaces, authorisation and access controls, and audit/detection tools. They will also include physical and procedural controls, for example, to restrict access to system components and to maintain awareness of new vulnerabilities affecting the system components.
As a minimum requirement, data loggers should not be accessible directly from the internet or should at least be protected via a firewall. Secure and restricted connection to data servers is also important.
The manufacturer of the datalogger and the monitoring platform should provide information on penetration tests for their servers, any command protocol activation channels, and the results of security audits for their products. Command functions should be sent using a secure VPN connection to the control device (best practice). Double authentication would be an even more secure option.
For further information, beyond the scope of this document, please look at the EU Cybersecurity Act (EC, 2019) and the European Parliament’s study “Cyber Security Strategy for the Energy Sector” (EP, 2016).
Types of data collected through the monitoring system
Irradiance measurements
Irradiance Sensors
Solar irradiance in the plane of the solar PV array (POA) is measured on-site by at least one irradiance Class A quality measurement device and ISO 9060:2018 (ISO 9060 2018). The higher the quality of the pyranometer, the lower the uncertainty will be. Best practice is to apply at least two pyranometers in the plane of the solar PV array. In case of different array orientations within the plant, at least one pyranometer is required for each orientation. It should be ensured that the pyranometers are properly assigned to the different arrays for the calculation of PR and Expected Yield.
Class A Pyranometers are preferred over silicon reference cells because they allow a direct comparison between the measured performance of the solar PV power plant and the performance figures estimated in the energy yield assessment. For plants in Central and Western Europe, measuring irradiance with silicon cells yields approximately 2 to 4% higher long-term PR than with a thermopile pyranometer (N. Reich et al. 2012).
Irradiance sensors must be placed in the least shaded location. They must be mounted and wired in accordance with manufacturers’ guidelines. Preventive Maintenance and calibration of the sensors must follow the manufacturers’ guidelines.
The irradiance should be recorded with a granularity of up to 15 minutes (minimum requirement).
Further information on the categorisation of plant sizes and the use of appropriate measuring technology is provided in IEC 61724-1.
Satellite-based Irradiance Measurements
In addition to irradiance sensors, complementary irradiance data from a high-quality satellite-based data service can be acquired after a certain period to perform comparisons with data from ground-based sensors. This is especially useful in case of data loss or when there is low confidence in the data measured onsite by the Monitoring System and it can be considered as best practice. In particular, high-quality satellite-based data should be used for irradiation sensor data quality assessments. The longer the period considered the lower the error will be for satellite-based irradiation data. For daily irradiation values, the error is relatively high, with root-mean-square error (RMSE) values of 8 to 14% in Western Europe. For monthly and annual values, it decreases below 5 and 3%, respectively, which is in line with an on-site sensor (Richter et al. 2015).
When satellite-based irradiance data is used, hourly granularity or less (15 minutes if possible) is recommended. The data must be retrieved once per day at least.
Module temperature measurements
Module temperature can be measured for performance analysis in KPIs such as the temperature-corrected PR.
The accuracy of the temperature sensor, including signal conditioning and acquisition done by the monitoring system hardware, should be < ±1 °C.
The temperature sensor should be attached to the middle of the backside of the module in the middle of the array table, in the centre of a cell, away from the junction box with appropriate and stable thermally conductive glue (Woyte et al. 2013). The installation should be in accordance with manufacturer guidelines (e.g., respecting cabling instructions towards the data logger).
Varying solar PV module temperature in a plant is mainly due to different wind exposure. Therefore, in large plants more sensors will be required across the site because module temperature should be measured at different representative positions (e.g., for modules in the centre of the plant and for modules at edge locations where temperature variation is expected).
The granularity of module temperature data should be at least 15 minutes to perform a correct PR calculation.
Local meteorological data
It is best practice to measure ambient temperature, wind speed, rain fall and other site relevant meteorological measurement with the installation of a local meteorological station in accordance with the manufacturers’ guidelines. Ambient temperature is measured with a shielded thermometer, such as a PT100. The shield protects the sensor from radiative heat transfer. Wind speed is measured with an anemometer, at 10m above ground level.
Wind and ambient temperature data are normally not required for calculating PR unless this is a contractual requirement/agreement (e.g., according to specific recommendations such as those from the National Renewable Energy Laboratory in the USA). However, they are required when the solar PV power plant is modelled in operation or retrospectively.
Additionally, whenever the module temperature measurements are not available or not suitable, wind speed and ambient temperature coupled with installation specifications can be used to retrieve a good estimation of module temperature. In this case, 15 minutes granularity of measurement is still the best practice.
For plants larger than 10 MWp, having automated collection of hourly meteorological data (ambient temperature, wind speed, snow coverage, rainfall) from independent sources is recommended. The reason for this is that on-site meteorological stations are subject to local phenomena and installation-specific results. Data from an independent weather-station is less subject to this, while being also more stable and robust with respect to long-term drift. They can therefore be used to evaluate the quality, and eventually replace, the on-site measurement.
Therefore, for both performance assessment and detailed analysis purposes, automated, local meteorological data is recommended. However, for performance assessment the most important measurement remains the in-plane irradiation (see Chapter 10. Key Performance Indicators).
Solar resource data derived from satellite image processing is available from several services at a nominal per-site and per time-segment (such as one week) fee. The measurement error in satellite data might be greater than that of an on-site instrument but is often more reliable than a mis-aligned, inadequate or dirty on-site pyranometer, and less susceptible to soiling or tampering.
String measurements
Individual string current measurements may be deployed when not supported by the inverters. String level monitoring allows for more precise trouble-shooting procedures than at inverter level. Depending on the module technology used in a plant, strings can be combined (in harnesses) which can help reduce operation costs.
To detect problems quickly and to increase plant uptime, installing string monitoring equipment is recommended. This will constantly measure the current of every string and register those measurements in intervals of up to at 15 minutes. To reduce costs, the current sensor can be used to measure more than one string. However, no more than two strings should be measured in parallel.
Inverter measurements
Inverters have a large set of variables that are constantly measured by their hardware, and that can be registered and investigated from the monitoring system. The data sent from the inverter to the monitoring system should be in cumulative values to allow the monitoring of the overall electricity generation of the inverter, even in case of outages of the monitoring system.
Recommended variables to be monitored are:
- Cumulative Energy generated (kWh)
- Instant Active Power injected (kW)
- Instant Reactive Power injected (kVAr)
- Instant Apparent Power injected (kVA)
- AC Voltage per each phase (V)
- AC Current per each phase (A)
- Power Factor / Cos Phi
- Frequency for each phase (Hz)
- Instant DC Power for each MPPT (kW)
- Instant DC Current for each MPPT (A)
- Instant DC Voltage for each MPPT (V)
- Total instant DC Power for all MPPTs (kW)
- Total instant DC Current for all MPPTs (A)
- Average instant DC Voltage for all MPPTs (V)
- Internal temperature (ºC)
- Conversion components temperature (ºC)
- Inverter failure signals
It should be noted that the precision of inverter-integrated measurements is not always documented by the manufacturers and can be imprecise. For example, energy or AC power measurements taken by inverters may differ substantially from the values recorded by the energy meter. Monitoring systems and reporting should specify and be transparent about the devices used to acquire each measurement.
It is also very useful to have the monitoring system collecting data from all the inverter alarms as they are a valuable source of information for fault detection. Also, low importance alarms or warnings can be used for the organisation of maintenance activities and even setting up Preventive Maintenance actions.
In certain cases, grid connections have limits that must be always respected, such as the maximum AC power that can be injected. For these cases there are two possibilities, one is to set limits using inverter parameters, the second one is to install Power Plant Controller that will change inverter parameters dynamically. In both cases it could be useful to monitor inverter parameters and to program alarms so that the O&M service provider is notified when there is a parameter that has been changed wrongly and does not respect a given limit.
Best practice dictates that the sample size for the measurement of inverter-based variables is 15 minutes at one minute interval. For ad-hoc performance analysis purposes such as allowing the analysis of solar PV array performance, root cause analysis or possible MPP-tracking problems, the input DC voltage and current need to be measured and stored separately.
In general, and as best practice, all common inverter parameters should be logged by the data loggers, since there are a lot of additional important parameters, such as internal temperature, and isolation level, etc. that could be useful for O&M services.
Inverters should be capable of detecting when their conversion components are overheating, to protect themselves under extreme or abnormal operating conditions. Therefore, it is advisable to record the temperature as provided by the inverter so that ventilation performance can be assessed.
Energy meter
One of the most important features of a monitoring system is the automated collection of energy meter data with a granularity of up to 15 minutes. Gathering energy meter data is required for invoicing purposes but it is also the best reference for measuring energy and calculating plant PR and Yield. It is also much more accurate than using inverter data.
Using a high accuracy energy meter to measure energy produced and consumed by the plant is normally required by the Utility. When this is not the case it is a best practice to install a meter with a maximum uncertainty of ± 0.5%, especially for plants > 100 kWp.
To allow data acquisition via the monitoring system, it is recommended to have a meter with two communication bus ports as well as Automatic Meter Reading (AMR) service from the Utility or Meter Operator.
For meters that can store historical data it is a best practice to have a Monitoring System capable of retrieving historical data to avoid any production data loss in case of Monitoring System outages.
Control settings
It is important to monitor all control settings of the plant at inverter- and grid injection-level (if available). Many plants apply control settings for local grid regulation (injection management) or optimisation of the market value of the solar PV generation portfolio (remote control). These settings need to be monitored for contractual reporting reasons and performance assessment.
Alarms
As a minimum requirement, the Monitoring System shall be able to generate the following alarms and, at the user’s discretion, send them by email:
· Loss of communication
· Plant stops
· Inverter stops
· Plant with Low Performance
· Inverter with Low Performance (e.g., due to overheating)
As best practice, the following alarms will also be sent by the monitoring system:
· String without current
· Plant under operation
· Discretion Alarm
· Alarm Aggregation
As a best practice, the following alarms should also be tracked by the O&M service provider. However, these alarms are sent by separate systems:
· Intrusion detection
· Fire alarm detection
The above lists are not exhaustive. For a comprehensive overview of recommended functionalities, refer to the Monitoring Checklist of the Solar Best Practices Mark.
AC circuit / Protection relay
Monitoring the status of MV switch gear and important LV switches through digital inputs is recommended. Whenever possible, it can also be useful to read and register the alarms generated by the protection relay control unit via communication bus.
Data collected by specialised solar PV module field inspections
Not all types of data are collected automatically through the monitoring system. Certain data are collected via on-site measurements and field inspections manually or with aerial inspections.
solar PV modules are engineered to produce electricity for 25-30 years and nowadays are being deployed in ever more and ever larger solar PV power plants. Quality assurance is the cornerstone for long-term reliability and maximising financial and energy returns. This makes tracking down the source of failures once modules have been installed vital. For that reason, field technical inspections, such as infrared (IR) thermography, electroluminescence (EL) imaging and I-V curve tracing, are being put into practice to assess the quality and performance of solar PV modules on-site.
Field inspections like these can be part of contractual Preventive Maintenance tasks or could be offered as additional services, triggered by the O&M service provider in cases where, for example, plant underperformance is not clearly understood just by looking at monitoring data.
Infrared thermography (IR)
Infrared (IR) thermographic data provides clear and concise indications about the status of solar PV modules and arrays and are used in both predictive and corrective maintenance.
Depending on its temperature, every object (e.g., a solar PV module) emits varying intensities of thermal radiation. As explained by Max Planck’s theories, this radiation measurement can be exploited for the determination of the actual temperature of objects. Thermal radiation – invisible to the human eye – can be measured using an infrared camera and is presented in the form of a thermal image. If abnormalities in solar PV modules occur, this typically leads to higher electrical resistance and thus a change in temperature of the affected module or cell. Based on the visual form and quantifiable temperature differences over the thermal image of a solar PV module, abnormalities such as hotspots, inactive substrings or inactive modules can be identified.
For thermographic data to be usable, a number of minimum requirements have to be met. Irradiance shall equal a minimum of 600 W/m2 and shall be continuously measured on-site, ideally orthogonally to the module surface. Infrared cameras need to possess a thermal resolution of at least 640 x 512 pixels and a thermal sensitivity of at least 0.04 K. Measurements shall be taken at a distance which ensures that the resolution of the infrared image equals 5 x 5 pixels per solar PV cell. Further requirements are to be found in IEC TS 62446-3 Part 3: Photovoltaic modules and plants – outdoor infrared thermography.
IR thermographic data can be captured with specialised IR thermographic cameras mounted either on manual hand-held devices or on drones. There are significant advantages in time and cost savings, speed and accuracy of data analysis and reporting, and worker health and safety that come with drone-enabled IR thermography as opposed to traditional manual inspection methods. The larger-scale the solar PV asset, the greater the advantages become. For more information, please refer to Chapter 6.6. Advanced Aerial Thermography.
Besides solar PV modules, IR thermography can also be used to inspect other important electrical components of a solar PV power plant, such as cables, contacts, fuses, switches, inverters, and batteries. For more information, see IEC TS 62446-3 Part 3: Photovoltaic modules and plants – outdoor infrared thermography and IEA-PVPS T13-10:2018 report: review on infrared and Electroluminescence imaging for solar PV Field applications.
The use of IR thermography alone is sometimes not enough to reach a conclusive diagnosis on the cause and the impact of certain solar PV module failures. Therefore, it is usually combined with the following complementary field tests.
I-V curve tracing on-site
Measurements of the I-V curve characteristic determine the power, short-circuit current, open-circuit voltage and other relevant electric parameters (shunt and series resistance, fill factor) of single solar PV modules or strings. The shape of the curve provides valuable information for identifying failures and it also provides a quantitative calculation of power losses. A typical outdoors I-V curve measurement setup consists of a portable I-V curve tracer. In combination with an irradiance sensor (a reference cell usually) and a thermometer this can be used to measure the solar PV modules electrical behaviour. As on-site ambient conditions differ greatly from those in a standardised lab, the measured results should be translated into STC.
Electroluminescence (EL) imaging on-site
EL images are typically taken of every module when leaving the factory production line and are a very useful baseline for the health of the module before leaving the factory. An EL image will show cell level imperfections and cracks which are invisible to the naked eye. EL imaging can be used on-site to better understand module quality post installation as well as further investigation following the identification of anomalies by thermography.
During the EL testing a material emits light in response to the passage of an electric current. This is applied in order to It is used to check integrity of solar PV modules. Here, a current flows through the solar PV-active material, and as a result, electrons and holes in the semiconductor recombine. In this process the electrons release their energy as light. EL imaging detects the near infrared radiation (NIR), i.e., wavelengths between 0.75 and 1.4 μm. The EL is induced by stimulating single solar PV modules or strings with a DC current supplied by an external portable power source. The NIR emissions then are detected by a silicon charge-coupled device (CCD) camera.
EL is usually done in a dark environment because the amount of NIR emitted by the solar PV modules is low compared to the radiation emitted by the background light and from the sun. This requires that EL imaging conducted on-site has to be done during the night, while covering the solar PV modules with a tent, or in a purpose-built mobile test lab. A typical setup consists of a modified single-lens reflex (SLR) camera, a tripod, a portable DC power supply and extension cables. Additionally, a high pass edge filter at 0.85 μm may be used to reduce interfering light from other sources. The resolution of the camera should be at least high enough so that the fingers of the solar cells in the module can be clearly identified. The noise of the camera output must be as low as possible (lowest ISO number possible) and the camera should be as steady as possible in order to avoid blurry images. Exposure times of 15 seconds are common.
High volume approaches to EL testing such as using drones are being offered by some niche service providers. See chapter 12 for further information.
Magnetic Field Imaging (MFI)
Magnetic field imaging (MFI) is a new and innovative method for quantitatively analysing flowing electric currents non-destructively, and without contact.
The underlying physics are very simple: every electric current generates a magnetic field. A magnetic field sensor creates an image of this by being moved over the current-carrying component. Strength and direction of the electric current can be inferred from this.
Current-carrying components such as solar cells, modules or batteries have a characteristic current distribution. If components have defects that influence the electrical current distribution significantly, the resulting magnetic field also changes. These changes can be detected by MFI and thus traced back to the defects.
The fields of application are manifold. In solar PV, defects relevant for the operation of solar modules can be detected reliably (Lauch et al, 2018; Patzold et al, 2019). These are, for example, broken connectors or ribbons (see Figure 3), missing solder joints or defective bypass diodes in the junction boxes of the modules.
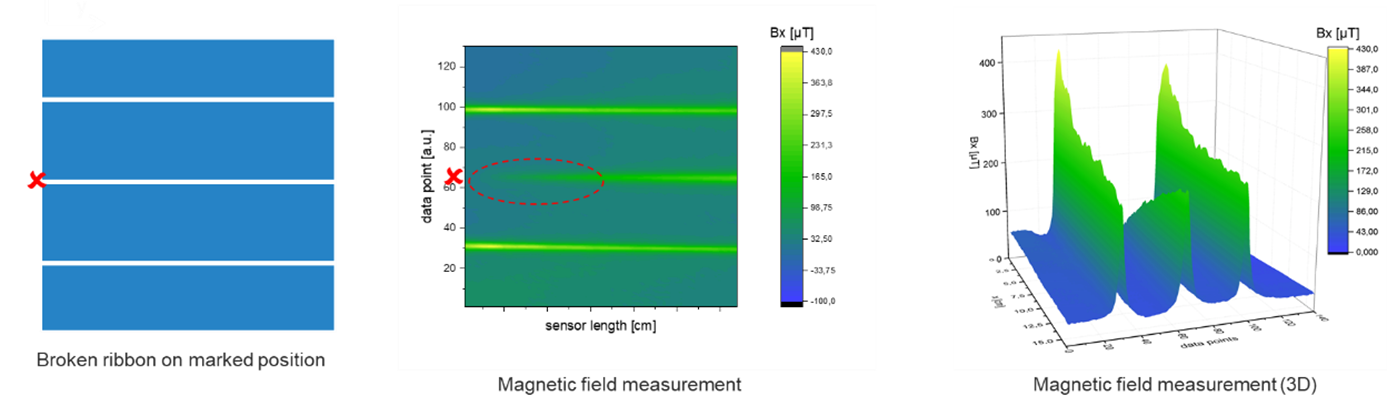
The advantages of the measurement technique that it is non-destructive, fast, and quantitative (the measurement signal is proportional to the underlying electric current). A disadvantage of using magnetic fields is that the distance to the sample must be in the millimeter range to produce high quality imaging results. The measurement cannot resolve microscopic structures (< 100 µm), yet.
Soiling measurements
The operational efficiency of modules is affected by soiling accumulation. Soiling limits the effective irradiance and, therefore, the output of the solar PV module. Measuring soiling I recommended as it can help optimise cleaning schedules and thus revenues. Several methodologies exist for soiling monitoring, the most basic being human inspections. A widely used soiling measurement method is using ground-based soiling reference modules consisting of a module that remains soiled, a cleaned reference cell, an automatic washing station and measurement electronics. There are several variations using different principles to measure the effect of soiling. Digital solutions for soiling monitoring that are currently under development include the analysis of satellite imagery with remote sensing techniques, machine intelligence algorithms and statistical methods. Possible soiling analyses include taking a swab of the soil to an analytical laboratory to determine its nature (diesel soot; pollen; organic soil; inorganic dust) and the appropriate cleaning solution.
Security systems
A. Health, Safety, and Security
Managing the risks that solar plants pose to the health and safety (H&S) of people, both in and around the plant, is a primary concern of all stakeholders. Solar plants are electricity generating power stations and pose significant hazards which can result in permanent injury or death. Risks can be mitigated through proper hazard identification, careful planning of works, briefing of procedures to be followed, and regular and well documented inspection and maintenance.
The dangers of electricity are well known and can be effectively managed through properly controlled access and supervision by the O&M service provider. Any person accessing a solar PV power plant should expect some form of introduction to ensure they are briefed on any hazards and risks. Staff working on electrical equipment must be appropriately trained, have sufficient experience, and be supervised. It is also key that others working around the equipment - for example panel cleaners - are equally aware of the potential risks and have safe methods of working around HV and LV electricity.
Hazardous areas and equipment should carry appropriate markings to warn personnel of possible hazards and wiring sequence. Such markings should be clear and evident to all personnel and third parties (and intruders) entering the plant premises.
As well as the inherent dangers of a typical solar plant, every site will have its own set of individual hazards which must be considered when working on the plant. An up-to-date plan of hazards is important for the O&M service provider to manage their own staff and provide third party contractors with adequate information. It is usually the case that the O&M service provider holds the authority and responsibility for reviewing and, where necessary, rejecting works taking place in the plant. Failure to carry this out properly has important consequences for general safety.
Besides workers on the solar plant, it is not unusual for other parties to require access to it. This may be the Asset Owner, or their representative, the landowner, or, in some situations, members of the public. It is important that the plant access control and security system keeps people away from areas of danger and that they are appropriately supervised and inducted as necessary.
The Asset Owner is ultimately responsible for compliance with H&S regulations within the site/plant. The Asset Owner must make sure that the installation and all equipment meet the relevant legislations of the country and, that all contractors, workers, and visitors respect the H&S Legislation by strictly following the established procedures, including the use of established personal protective equipment (PPE).
At the same time, the O&M service provider should prepare and operate their own safety management systems, previously agreed with the Asset Owner, that take into account site rules relating to H&S and the potential hazards involved in the works. The O&M service provider should ensure that they, and all subcontractors, comply with H&S legislation.
The Asset Owner will expect the O&M service provider to assume the role and duties of the principal contractor under the relevant national regulations governing H&S. This involves the O&M service provider proving that they are competent and are able to allocate enough resources to fulfil these duties.
Before starting any activity on-site, the Asset Owner will deliver a risk assessment and method statements to the O&M service provider who will provide a complete list of personnel training certifications and appoint a H&S coordinator. During the whole duration of the contract the O&M service provider will keep the H&S file of each site up to date.
The O&M service provider must have their personnel trained in full compliance with respective national legal and professional requirements. This generally includes obtaining certification necessary for working in a variety of environments, such as MV and/or HV electrical plants. Within Europe, referral to European Standards is not sufficient (examples of standards used today are ISO 14001, OHSAS 18001 etc).
To achieve a safe working environment, all work must be planned in advance. Normally written plans are required.
Risk assessments which detail all the hazards present and the steps to be taken to mitigate them need to be produced.
The following dangers are likely to exist on most solar plants and must be considered when listing hazards and identifying risks. The severity of any injuries caused are exacerbated by the terrain on which solar plants are built and their remoteness.
1. Medical problems
It is critical that all personnel engaged in work on solar plants have considered and communicated any pre-existing medical problems and any additional measures that may be required to deal with them
2. Slips, trips, and falls
The terrain, obstacles and equipment installed on a solar farm provide plenty of opportunities for slips, trips and falls both at ground level and whilst on structures or ladders; and for roof-top or carport systems, fall-protection and additional equipment is required when working at heights
3. Collisions
Collisions can occur between personnel, machinery/vehicles and structures. The large areas covered by solar farms often necessitate the use of vehicles and machinery which, when combined with the generally quiet nature of an operational solar plant, can lead to a lack of attention. General risks such as difficult terrain, reversing without a banksman and walking into the structure supporting the solar panels require special attention
4. Strains and sprains
Lifting heavy equipment, often in awkward spaces or from uneven ground, presents increased risk of simple strains or longer-term skeletal injuries
5. Electrocution
Operational solar plants, whether energised or not, present a significant risk of electrocution to personnel. This risk is exacerbated by the nature and voltage of the electricity on site and the impossibility of total isolation. Staff engaged in electrical work obviously suffer the greatest risk but everybody on site is at risk from step potential and other forms of electrocution in the event of a fault. Specific training needs to be given to all those entering a solar farm on how to safely deal with the effects of electrocution. In addition to general electrical safety, common issues for solar PV power plants include arc-flash protection when working on energized circuits; and lock-out-tag-out to ensure circuits are not unintendedly energised
6. Fire
Several sources of combustion exist on a solar farm, the most common being electrical fire. Others include combustible materials, flammable liquids, and grass fires. Safe exit routes need to be identified and procedures fully communicated. All personnel need to be fully aware of what to do to avoid the risk of fire and how to act in the event of a fire
7. Mud and water
Many solar farms have water travelling through them such as streams and rivers, some have standing water, and some are floating arrays. Mud is a very common risk particularly in winter as low-grade farmland is often used for solar farms. Mud and water present problems for access as well as electrical danger
8. Mechanical injury
Hand-tools, power tools, machinery, and mechanisms such as unsecured doors can present a risk of mechanical injury on site
9. Weather
The weather presents a variety of hazards, the most significant of which is the risk of lightning strike during an electrical storm. Due to the metal structures installed on a solar farm an electrical storm is more likely to strike the solar array than surrounding countryside. A solar farm MUST be vacated for the duration of any electrical storm. Working in cold and rainy weather can cause fatigue and injury just as working in hot sunny weather presents the risk of dehydration, sunburn, and sun stroke. Working during sunny days for undertaking maintenance and/or testing on site can lead to sunstroke. To avoid this, drinking sufficient water and staying in the shade is recommended
10. Wildlife and livestock
The renewable energy industry is proud to provide habitats for wildlife and livestock alongside the generation of electricity. Some wildlife, however, presents dangers. There are plants in different regions which can present significant risk, some only when cut during vegetation management. Animals such as rodents and snakes, insects such as wasps, and other wildlife and livestock can present significant risks. The nature of these risks will vary from place to place, and personnel need to be aware of what to do in the event of bites or stings. Snakes, spiders, ticks, bees, and bugs are common and pose a number of hazards where snake bites could be lethal, spider bites can cause pain and inflammation, tics bites could result in tick bite fever, bees can cause allergic reactions and bugs could fly into people’s eyes. It is therefore important that all precautions are taken to prevent or manage these incidents. Storage and application of pesticides, herbicides, and rodent poisons also introduce health and safety hazards. For example, Glyphosate was very common in controlling vegetation at solar PV power plants and has been found to be carcinogenic. Mowing has several hazards including flying objects. Every job at a solar PV site should have safety precautions identified and implemented
Everyone entering a solar farm, for whatever reason, should have been trained in the dangers present on solar farms and be trained for the individual task that they will be performed. They should have all the PPE and tools necessary to carry out the work in the safest way possible. The work should be planned, and everyone concerned should have a common understanding of all aspects related to the safe execution of their task. Different countries will mandate written and hard copy paperwork to meet legislation, but best practice is to exceed the minimum requirements and to embrace the spirit of all relevant legislation.
Best practice in H&S sees the ongoing delivery of training and sharing of lessons learned. By increasing the skills of persons involved in the industry, we can make the industry safer and more productive.
B. Power plant security
It is important that the solar PV power plant, or key areas of it, are protected from unauthorised access. This serves the dual purpose of protecting the plant’s equipment and keeping members of the public safe. Unauthorised access may be accidental with people wandering into the plant without realising the dangers, or it may be deliberate for the purposes of theft or vandalism.
Together with the O&M service provider and the security service provider, the Asset Owner must put in place a Security Protocol in case an intrusion is detected.
In most countries there are strict legal requirements for security service providers. Therefore, solar PV power plant security should be ensured by specialised security service providers subcontracted by the O&M service provider. The security service provider will be responsible for the proper functioning of all the security equipment including intrusion and surveillance systems. They are also responsible for processing alarms from the security system by following the Security Protocol and the use of the surveillance systems installed on site. The security system provider will be also responsible for any site patrolling or other relevant services. The security service provider should also assume liability for the security services provided. The O&M service provider will coordinate with the security service provider and may choose to act as an intermediary with the Asset Owner.
A security system may be formed of simple fencing or barriers but may also include alarm detection and alerting systems and remote closed-circuit television (CCTV) video monitoring. If solar PV power plants have CCTV systems in place, an access protocol would be required when reactive and planned works are carried out. This will ensure that authorised access is always maintained. This can be done by way of phone with passwords or security pass codes, both of which should be changed periodically.
For additional security and in high-risk areas it is advisable to have a backup communication line installed (often, the first thing that gets damaged in case of vandalism is communication with the surveillance station) as well as an infrastructure for monitoring connectivity and communication with the security system. As well as any remote monitoring, it is likely that provision for onsite attendance is required when significant events occur. Processes for liaising with local emergency services should be considered.
Within the solar plant, there may also be additional areas with restricted access, for example locations containing High Voltage equipment. When authorising access to the parks it is important that all workers and visitors are appropriately informed of the specific access and security arrangements and where they should or should not be. Warning signs and notices can form an important part of this and may be compulsory depending on local regulations.
As well as the general security of the site over the lifetime of the park, particular attention should be made to periods of construction or maintenance when usual access arrangements may be different. It is important that security is always maintained particularly when there are activities that may be of more interest to members of the public or thieves.
The Asset Owner will likely have insurance policies in place directly or indirectly and these will be dependent on certain levels of security and response being maintained. Failure to meet these may have important consequences in the case of an accident or crime.
C. Data and Monitoring Requirements
In general, monitoring systems should allow follow-up on the energy flows within a solar PV system. In principle, it reports on the parameters that determine the energy conversion chain. These parameters, along with the most important energy measures in terms of yields and losses, are illustrated in Figure 4. These yields and losses are always normalised to installed solar PV power at standard test conditions in kilowatt-peak (kWp) for ease of performance comparison.
All components and different aspects of technical data management and monitoring platforms are described in the following paragraphs. Reference should also be made to the Monitoring Checklist of the Solar Best Practices Mark for a synthesis of the most important best practices and recommendation with respect to these points.
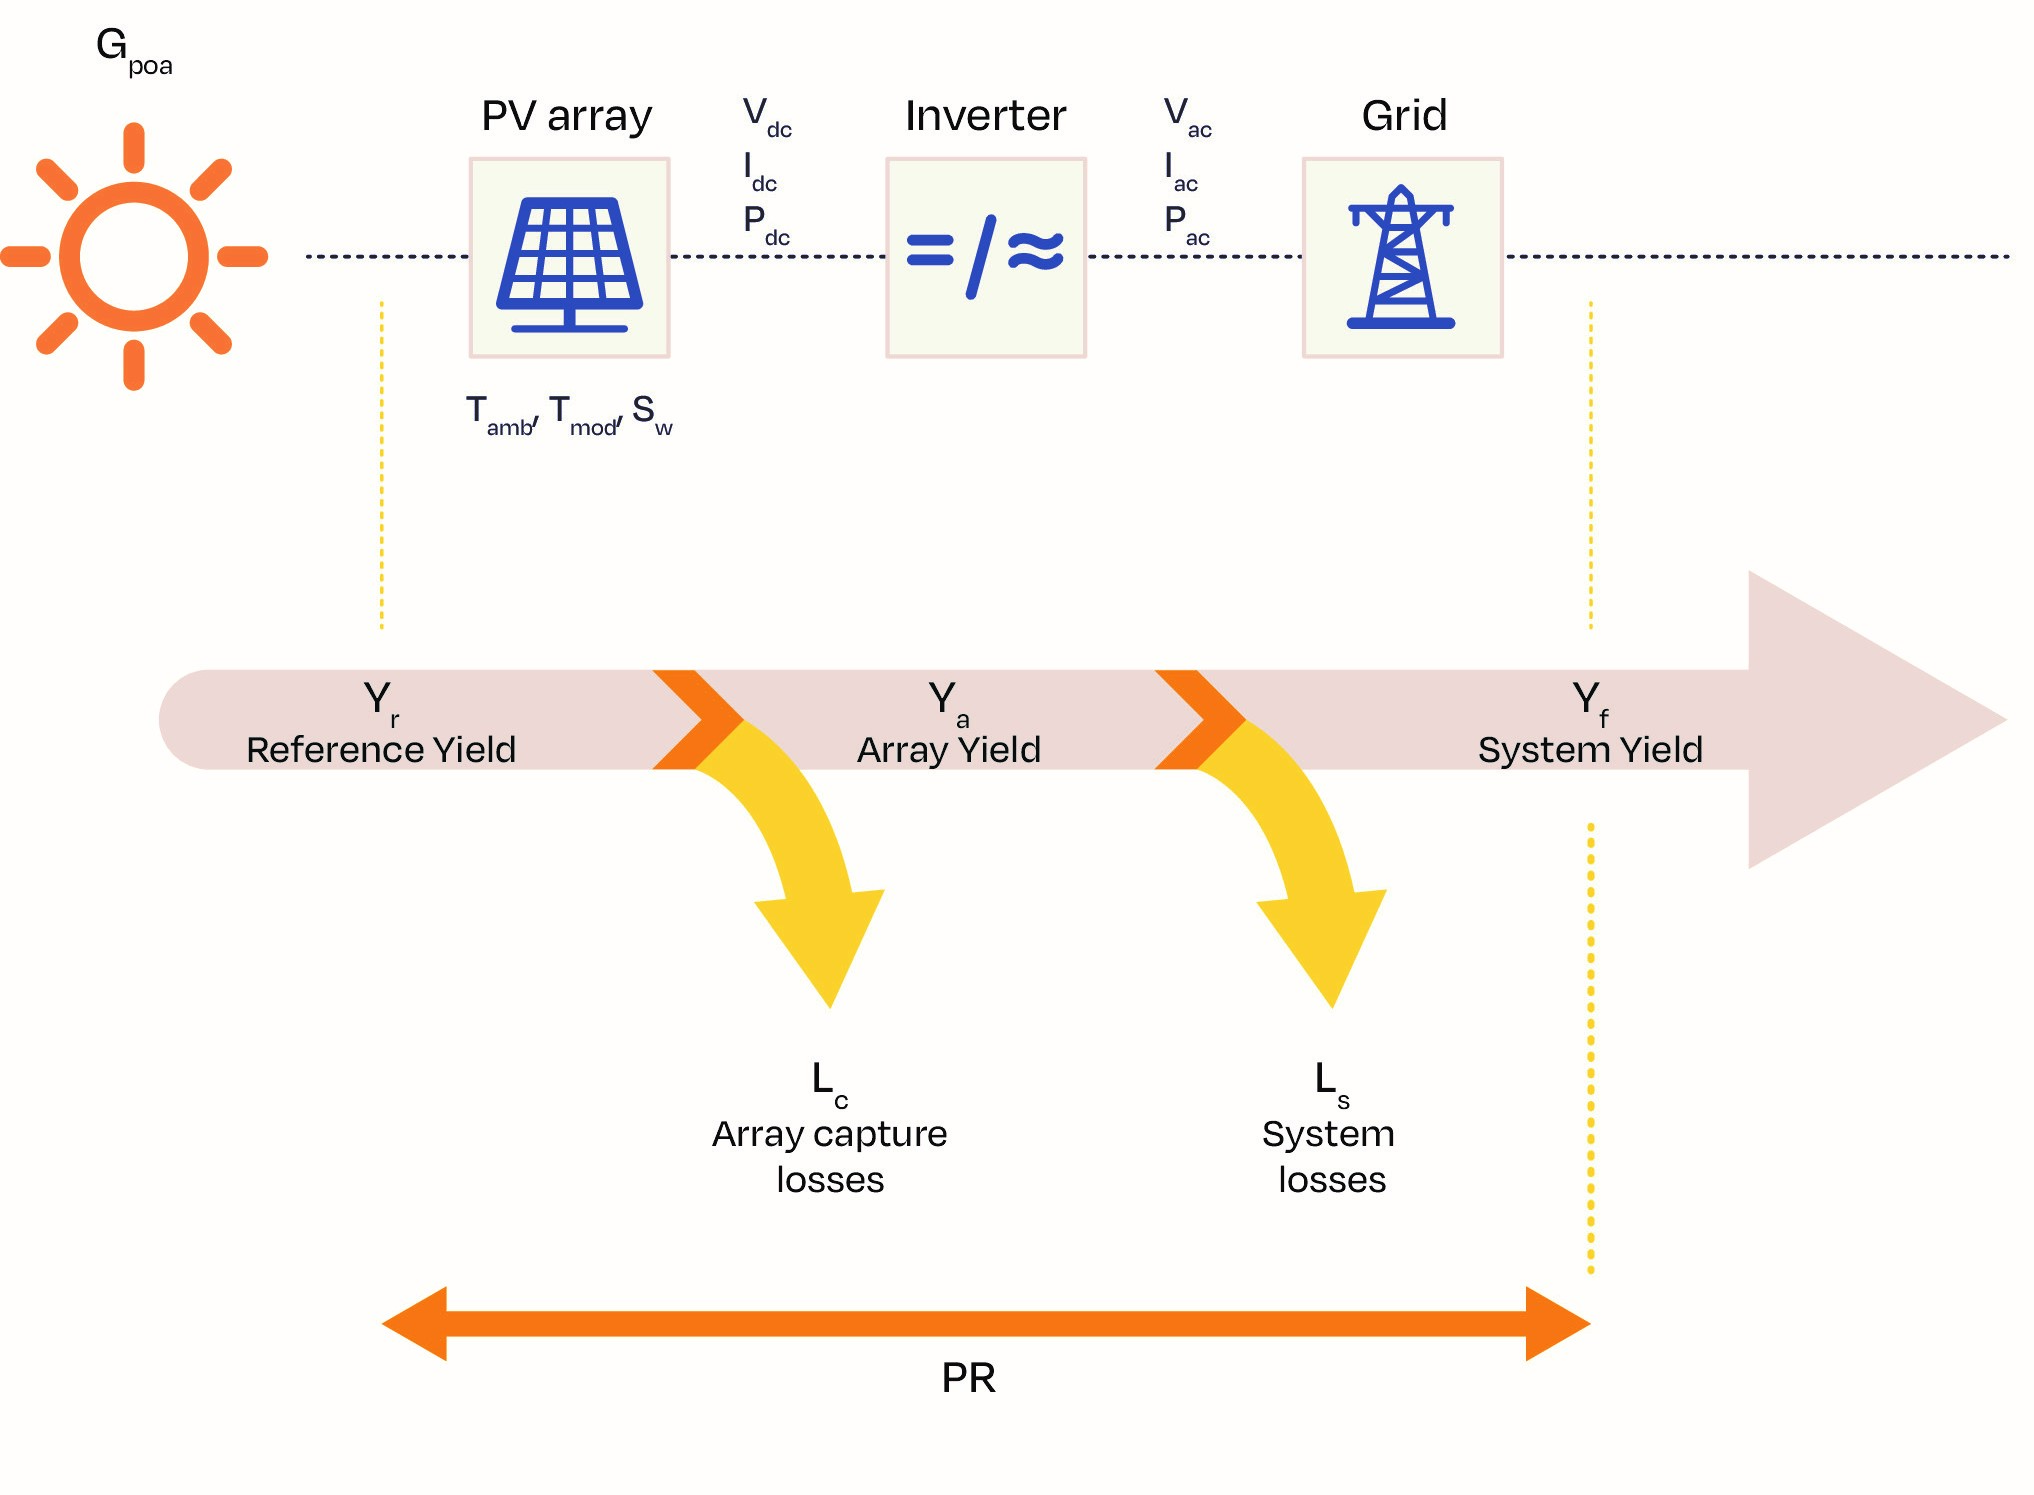
Data loggers
The main purposes of a datalogger are:
· Collecting data of relevant components (inverters, meteorological data, energy meter, string combiners, status signals) with every device registered separately
· Basic alarm functionality (e.g., Field Communication issues, time critical events like AC Off)
· Providing a temporary data backup (in case of missing internet connection)
· Supporting the technicians during commissioning (e.g., checking whether all inverters work and feed-in)
In addition to this, some dataloggers can also provide the following functions:
· Power Plant Controller (Monitoring & Control should be managed by one instance to avoid communication issues regarding concurrent access). The Power Plant Controller can be integrated in the datalogger or can be a separate device using the communication channel of the datalogger or even a separate one with preferential bandwidth
· Solar Energy Trading Interface (control the active power by a third-party instance like energy trader)
As best practice, dataloggers should be selected following a list of criterion by the operating party as listed below. For example, an EPC service provider will choose and install the data logger used to monitor the site. This datalogger should be selected:
· for its compatibility with the inverters and auxiliary equipment present on site. Preference for inverter-agnostic dataloggers
· for any command functionality that may be needed (this is site type and country specific)
· for its connectivity strength to the internet
· for its robustness (longevity of life and durability for the environmental conditions it will be kept in)
· for its cyber security measures (and those of the cloud server to which it is connected), namely the possibility to set up a VPN tunnel at least
· for its capability to store data during internet communication outages
The recording interval (also called granularity) of the datalogging should range from 1 minute to 15 minutes. Within one monitoring environment granularity should be uniform for all the different data collected.
As a minimum requirement, data loggers should store at least one month of data. Historical data should be backed up constantly by sending it to external servers and, after every communication failure, the data logger should automatically send all pending information. Moreover, data transmission should be secure and encrypted. There should also be a logbook to track configuration changes (especially relevant when acting as Power Plant Controller).
As a best practice, the data logger should store a minimum of three months of data locally and a full data backup in the cloud. Moreover, the operation of the data logger itself should be monitored. This should be done remotely and from an independent server, delivering information on the data loggers’ operating status at Operating System (OS) and hardware level. It should also provide alerts to the Operations room in case of failures and communication loss.
Best practice is to have dataloggers and routers constantly monitored by a watchdog device on-site. In case of no response to the control unit, the power supply will be interrupted by the watchdog unit, performing a hard reset on the stopped equipment. In cases where it is not possible to have an external watchdog it can be useful to have an automatic reboot function.
The entire monitoring installation should be protected by an uninterruptable power supply (UPS). This includes data loggers, network switches, internet modems/routers, measurement devices and signal converters.
Data Quality & Curation
The main purpose of the monitoring system is to collect data from all the relevant components (energy meters, meteorological sensors, inverters, string combiner boxes, etc.) which are typically installed across the field and connected to the plant SCADA through the local network by using various technologies (serial links, cable, fiber, wireless, etc.). Moreover, renewable plants, and solar plants, are often situated in remote environments, and sometimes in harsh places. As such, equipment and systems are subject to difficult conditions and are often subject to data quality issues.
The data quality issues that equipment may face may be categorised as follow:
· False negative values
· Outliers
· Spikes
· Data gaps
· Junk values
These data quality issues can provoke situations that vary extremely depending on the plant, type of measurement, or systems in place. As such, it is very difficult to implement an overall and systematic data quality strategy for renewable Asset Owners as each case is unique.
The data quality issues mentioned above are obvious and may impact many KPIs which are calculated on this basis. More challenging to identify, are slight and progressive data deviations overtime.
Biased KPIs lead to unnecessary operations costs (unrequired on-site intervention) and performances losses, as defects may remain undetected.
As a best practice, the monitoring solution and system should be capable of filtering these values in the most automated and personalised way to cater for each specific case.
Most effective techniques for data validation are based on the analysis of data over relatively long timespans (i.e., daily data validation), with a granularity between 1 and 15 minutes.
Monitoring (web) portal
The main purposes of the monitoring portal are:
· Reading any type of raw data coming from any type of data logger or other solar PV platforms with no preference on brands or models
· Creating a long-term archive for all raw data provided by the asset
· Modelling each solar PV asset using all available information regarding the actual set up and devices (type of devices, installation/replacement date, modules-string-inverter system layout, modules inclination, orientation, type of installation etc.)
· Visualising aggregated data in the highest possible granularity (1 to 15 min is a best practice for most of the indicators)
· Visualising data in standard and specific diagrams
· Computing and visualising dashboards and views of KPIs. For the list of indicators to be computed, see Chapter 10. Indicators computational inputs might be selectable by the user
· Validating data quality (e.g., through calculation of data availability)
· Detecting malfunctions as well as long term degradations with customisable alarms
· Handling alerts from field devices like dataloggers or inverters
· Calculating typical KPIs (such as PR and Availability) with the possibility to adapt parameters
· Providing consistent and easy to use aggregated KPIs for customisable reports for single plants and portfolios
· Making data available via a standardised interface for use in other systems
The monitoring portal should fulfil the following minimum requirements:
· Accessibility level of at least 99% across the year
· Interface and/or apps dedicated to use cases (on-site service, investor etc)
· Customisable user Access Level
· Graphs of irradiation, energy production, performance, and yield
· Downloadable tables with all the registered figures
· Alarms register
As best practice, the following features will also be included in the Monitoring Portal:
· Configurable User Interface to adjust the views depending on the target group (e.g., O&M service provider, EPC service provider, Investor, Asset Manager)
· User configurable alarms
· User configurable reports
· Ticket system to handle alarm messages
· Plant specific KPIs
· Integrate Third Party Data (e.g., solar power forecast, meteorological data, satellite data for irradiance)
· Granularity of data should be adaptable for downloads of figures and tables
The above lists are not exhaustive. For a comprehensive overview of recommended functionalities, refer to the Monitoring Checklist of the Solar Best Practices Mark.
Data format
The data format of the recorded data files must respect standards such as IEC 61724 and must be clearly documented. Data loggers should collect all inverter alarms in accordance with original manufacturer’s format so that all available information is obtained.
Configuration
The configuration of the monitoring systems and data loggers needs to reflect the actual layout of plant details (hardware brand, model, installation details such as orientation, wiring losses, set up date, etc.) to better perform expected performances simulations and obtain consistent insight about a plant’s actual status. If this has not been done during the plant’s construction phase, it should be done at the commissioning phase or when a new O&M service provider takes over (recommissioning of the monitoring system).
During commissioning, each single piece equipment monitored should be checked to make sure it is properly labelled in the Monitoring System. This can be done by temporarily covering insolation sensors or switching off others such as string boxes or inverters.
It is best practice to have a Monitoring System capable of reading and recording all IDs from all sensors and equipment it monitors. This will reduce the possibility of mislabelling elements and improve the tracing of equipment and sensor replacement during the life of the facility. Some Monitoring Systems have even an auto-configuration feature (plug-and-play) that reduces start-up time and potential mistakes. This it is done by automatically capturing device IDs and configuration information. This also allows for automatic detection of inverter or sensor replacement.
Interoperability
As a best practice, the system should ensure open data accessibility (both for sending and receiving data bilaterally) to enable easy transition and communication between monitoring platforms. Table 5 shows some examples of data integration options. Due to the lack of unifying standards, every Monitoring System provider has their own method of storing and retrieving data. The best systems can retrieve data by using open interfaces such as RESTful, providing interoperability between different systems.
Another important aspect of interoperability is the ability to aggregate data from different platforms that serve a range of areas in the solar PV business, such as administration, accountancy, planning & on-site intervention, and stock management applications. This way, information can be exploited by the central monitoring platform without affecting the external applications. For example, an O&M service provider works with several types of ticketing systems for different clients. The monitoring platform should be able to collect data from all of them. Likewise, information about tickets managed from the central monitoring system should be automatically transferable to the dedicated ticketing application.
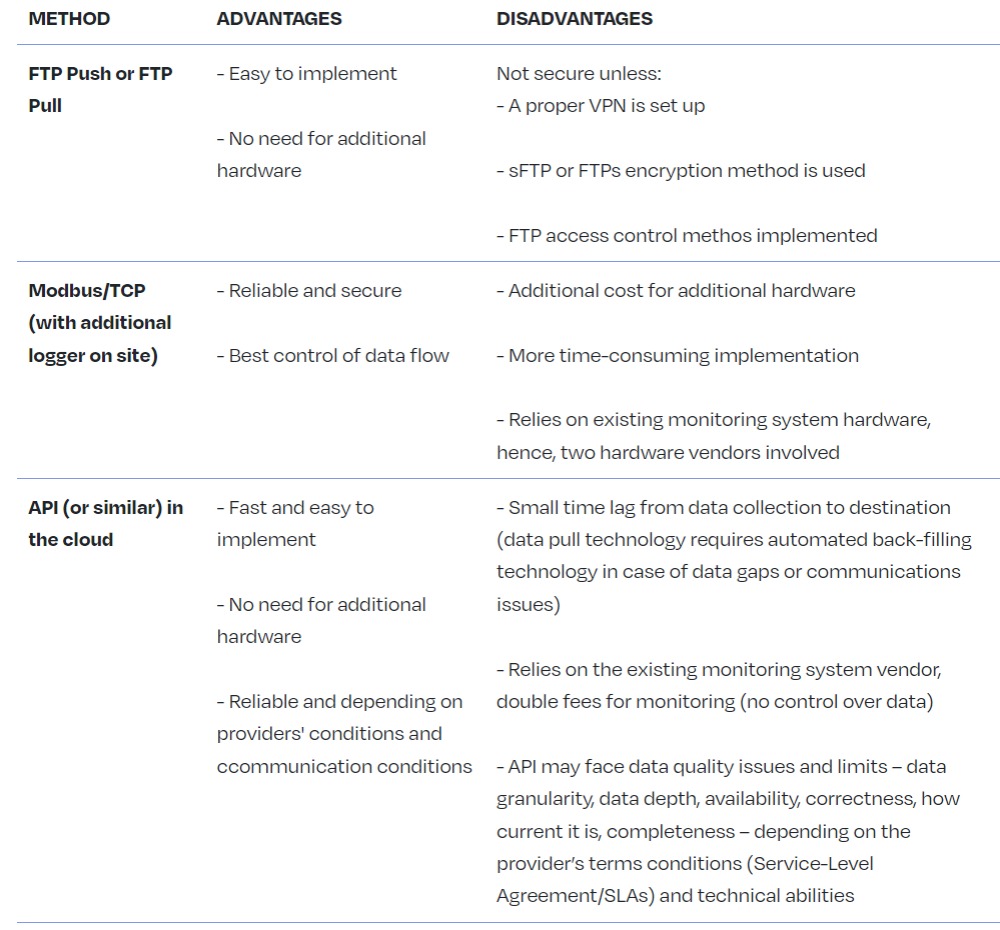
Internet connection and Local Area Network
The O&M service provider should make sure to provide the best possible network connectivity. As a minimum requirement, the bandwidth needs to be adequate enough to transfer data in a regular way.
Whenever a fibre connection is available within the solar PV-site area, this should be used to connect to the internet, with industrial routers considered as standard. Where a fibre connection is unavailable, 4G or Wi-Fi communication is preferred. Satellite connection is the least preferred communication type. An additional back-up system is best practice. Any subscription should allow for the data quantity required and should foresee the amount (e.g., Closed-Circuit Television (CCTV) or not)granularity of the data.
For solar PV power plants larger than 1MW it is advised to have a WAN connection and as an alternative to an industrial router, that allows for mobile or satellite communication back-up in case the WAN connection fails. A system with a reset capability in case of loss of internet connection is recommended. A direct connection to a monitoring server with an SLA guarantees continuous data access. If data passes via alternative monitoring servers without an SLA, (e.g., monitoring portal of the inverter manufacturer), the SLA can no longer be guaranteed. The automatic firmware updates of the data logger should be disabled. Firmware updates are subject to a change management procedure with the monitoring service.
All communication cables must be shielded. Physical distances between (DC or AC) power cables and communication cables should be ensured, and communication cables should be shielded from direct sunlight. Furthermore, cables with different polarities must be clearly distinguishable (label or colour) for avoiding polarity connection errors.
Pros and cons of different types of monitoring connections:

Data ownership and privacy
The data from the monitoring system and data loggers, even if hosted in the cloud, should always be owned by and accessible to the Asset Owner (or SPV). Stakeholders such as the O&M service provider and the Asset Manager need the data to perform their duties and should be granted access. In addition to this, auditors working in the due diligence phases of a project should also have access. It is important to have at least two access levels (read-only, full access).
The monitoring system hardware can be provided by the O&M service provider or a third-party monitoring service provider (but the monitoring system hardware remains the property of the Asset Owner as part of the installation):
· If the O&M service provider is the monitoring service provider, they have full responsibility for protecting and maintaining the data, and ensuring the proper functioning of the monitoring system
· Where there is a third-party monitoring service provider, responsibility for protecting and maintaining the data resides with them. The O&M service provider should endeavours to make sure performance monitoring is correct and takes the best practices mentioned in the previous paragraphs into consideration. The O&M service provider’s ability to properly maintain and use the monitoring system should be evaluated. If necessary, the O&M service provider should be appropriately trained to use the monitoring system. Data use by third-party monitoring providers should be extremely limited, i.e., for correcting bugs and developing additional functions to their systems.
Cybersecurity
As solar PV power plants have inverters and power plant controllers (and monitoring systems) that are connected to the internet to enable surveillance and remote instructions by operators, there are significant cybersecurity risks.
Cybersecurity comprises technologies, processes and controls that are designed to protect systems, networks, and data from cyber-attacks. Effective cyber security reduces the risk of cyber-attacks and protects organisations and individuals from the unauthorised exploitation of systems, networks, and technologies.
Cybersecurity is a vast area and multiple measures are possible. The following hints may help as a starting point:
· Keep it simple: If possible, reduce the type of network devices to a minimum
· As a recommendation, traffic of the network devices may be monitored to detect abnormally high use of bandwidth
· Secure physical access to the network devices and implement a secure password policy. Avoid the use of standard passwords and change all factory setting passwords
· Control access from Internet via strict firewall rules:
- Port forwarding should not be used because this is a big security gap. Only router ports that are necessary should be opened
- Reduce remote access to the necessary use cases
- The use of VPNs (Virtual Private Networks – a secure connection built up from the inside of the private network) is necessary
- VPN access to the site from outside is a minimum requirement
- A VPN server or VPN service which works without requiring a public IP on-site is preferred
- Each solar PV power plant should have different passwords
- Keep your documentation up to date to be sure that no device has been forgotten
- Use different roles to the extent possible (e.g., read only user, administration access)
- Use professional (industrial grade) hardware; only this hardware provides the security and administration functions your plant needs to be secure
· Implement vulnerability management (i.e., identifying and fixing or mitigating vulnerabilities, especially in software and firmware):
- Improve insecure software configurations
- The firmware and software of devices should be kept up to date
- Use anti-virus software if possible and keep it up to date
- Avoid wireless access if it is not necessary
- Audit your network with the help of external experts (penetration tests)
· Keep your company safe:
- Do not store passwords in plain text format, use password manager (e.g., 1Password, Keepass, etc.)
- Train your employees on IT security awareness
- Do not share access from all plants to all employees. Give access only to those who need it. This way damage can be limited if an individual employee is hacked
- Management of leaving and moving employees; change passwords of plants which are overseen by an employee who has left the company or moved to another department
It is therefore best practice that installations undertake a cyber security analysis, starting from a risk assessment (including analysis at the level of the system architecture) and implement a cybersecurity management system (CSMS) that incorporates a plan-do-check-act cycle. The CSMS should start from a cybersecurity policy, and definition of formal cybersecurity roles and responsibilities, and proceed to map this onto the system architecture in terms of detailed countermeasures applied at identified points (e.g., via analysis of the system in terms of zones and conduits). These will include the use of technical countermeasures such as firewalls, encrypted interfaces, authorisation and access controls, and audit/detection tools. They will also include physical and procedural controls, for example, to restrict access to system components and to maintain awareness of new vulnerabilities affecting the system components.
As a minimum requirement, data loggers should not be accessible directly from the internet or should at least be protected via a firewall. Secure and restricted connection to data servers is also important.
The manufacturer of the datalogger and the monitoring platform should provide information on penetration tests for their servers, any command protocol activation channels, and the results of security audits for their products. Command functions should be sent using a secure VPN connection to the control device (best practice). Double authentication would be an even more secure option.
For further information, beyond the scope of this document, please look at the EU Cybersecurity Act (EC, 2019) and the European Parliament’s study “Cyber Security Strategy for the Energy Sector” (EP, 2016).
Types of data collected through the monitoring system
Irradiance measurements
Irradiance Sensors
Solar irradiance in the plane of the solar PV array (POA) is measured on-site by at least one irradiance Class A quality measurement device and ISO 9060:2018 (ISO 9060 2018). The higher the quality of the pyranometer, the lower the uncertainty will be. Best practice is to apply at least two pyranometers in the plane of the solar PV array. In case of different array orientations within the plant, at least one pyranometer is required for each orientation. It should be ensured that the pyranometers are properly assigned to the different arrays for the calculation of PR and Expected Yield.
Class A Pyranometers are preferred over silicon reference cells because they allow a direct comparison between the measured performance of the solar PV power plant and the performance figures estimated in the energy yield assessment. For plants in Central and Western Europe, measuring irradiance with silicon cells yields approximately 2 to 4% higher long-term PR than with a thermopile pyranometer (N. Reich et al. 2012).
Irradiance sensors must be placed in the least shaded location. They must be mounted and wired in accordance with manufacturers’ guidelines. Preventive Maintenance and calibration of the sensors must follow the manufacturers’ guidelines.
The irradiance should be recorded with a granularity of up to 15 minutes (minimum requirement).
Further information on the categorisation of plant sizes and the use of appropriate measuring technology is provided in IEC 61724-1.
Satellite-based Irradiance Measurements
In addition to irradiance sensors, complementary irradiance data from a high-quality satellite-based data service can be acquired after a certain period to perform comparisons with data from ground-based sensors. This is especially useful in case of data loss or when there is low confidence in the data measured onsite by the Monitoring System and it can be considered as best practice. In particular, high-quality satellite-based data should be used for irradiation sensor data quality assessments. The longer the period considered the lower the error will be for satellite-based irradiation data. For daily irradiation values, the error is relatively high, with root-mean-square error (RMSE) values of 8 to 14% in Western Europe. For monthly and annual values, it decreases below 5 and 3%, respectively, which is in line with an on-site sensor (Richter et al. 2015).
When satellite-based irradiance data is used, hourly granularity or less (15 minutes if possible) is recommended. The data must be retrieved once per day at least.
Module temperature measurements
Module temperature can be measured for performance analysis in KPIs such as the temperature-corrected PR.
The accuracy of the temperature sensor, including signal conditioning and acquisition done by the monitoring system hardware, should be < ±1 °C.
The temperature sensor should be attached to the middle of the backside of the module in the middle of the array table, in the centre of a cell, away from the junction box with appropriate and stable thermally conductive glue (Woyte et al. 2013). The installation should be in accordance with manufacturer guidelines (e.g., respecting cabling instructions towards the data logger).
Varying solar PV module temperature in a plant is mainly due to different wind exposure. Therefore, in large plants more sensors will be required across the site because module temperature should be measured at different representative positions (e.g., for modules in the centre of the plant and for modules at edge locations where temperature variation is expected).
The granularity of module temperature data should be at least 15 minutes to perform a correct PR calculation.
Local meteorological data
It is best practice to measure ambient temperature, wind speed, rain fall and other site relevant meteorological measurement with the installation of a local meteorological station in accordance with the manufacturers’ guidelines. Ambient temperature is measured with a shielded thermometer, such as a PT100. The shield protects the sensor from radiative heat transfer. Wind speed is measured with an anemometer, at 10m above ground level.
Wind and ambient temperature data are normally not required for calculating PR unless this is a contractual requirement/agreement (e.g., according to specific recommendations such as those from the National Renewable Energy Laboratory in the USA). However, they are required when the solar PV power plant is modelled in operation or retrospectively.
Additionally, whenever the module temperature measurements are not available or not suitable, wind speed and ambient temperature coupled with installation specifications can be used to retrieve a good estimation of module temperature. In this case, 15 minutes granularity of measurement is still the best practice.
For plants larger than 10 MWp, having automated collection of hourly meteorological data (ambient temperature, wind speed, snow coverage, rainfall) from independent sources is recommended. The reason for this is that on-site meteorological stations are subject to local phenomena and installation-specific results. Data from an independent weather-station is less subject to this, while being also more stable and robust with respect to long-term drift. They can therefore be used to evaluate the quality, and eventually replace, the on-site measurement.
Therefore, for both performance assessment and detailed analysis purposes, automated, local meteorological data is recommended. However, for performance assessment the most important measurement remains the in-plane irradiation.
Solar resource data derived from satellite image processing is available from several services at a nominal per-site and per time-segment (such as one week) fee. The measurement error in satellite data might be greater than that of an on-site instrument but is often more reliable than a mis-aligned, inadequate or dirty on-site pyranometer, and less susceptible to soiling or tampering.
String measurements
Individual string current measurements may be deployed when not supported by the inverters. String level monitoring allows for more precise trouble-shooting procedures than at inverter level. Depending on the module technology used in a plant, strings can be combined (in harnesses) which can help reduce operation costs.
To detect problems quickly and to increase plant uptime, installing string monitoring equipment is recommended. This will constantly measure the current of every string and register those measurements in intervals of up to at 15 minutes. To reduce costs, the current sensor can be used to measure more than one string. However, no more than two strings should be measured in parallel.
Inverter measurements
Inverters have a large set of variables that are constantly measured by their hardware, and that can be registered and investigated from the monitoring system. The data sent from the inverter to the monitoring system should be in cumulative values to allow the monitoring of the overall electricity generation of the inverter, even in case of outages of the monitoring system.
Recommended variables to be monitored are:
- Cumulative Energy generated (kWh)
- Instant Active Power injected (kW)
- Instant Reactive Power injected (kVAr)
- Instant Apparent Power injected (kVA)
- AC Voltage per each phase (V)
- AC Current per each phase (A)
- Power Factor / Cos Phi
- Frequency for each phase (Hz)
- Instant DC Power for each MPPT (kW)
- Instant DC Current for each MPPT (A)
- Instant DC Voltage for each MPPT (V)
- Total instant DC Power for all MPPTs (kW)
- Total instant DC Current for all MPPTs (A)
- Average instant DC Voltage for all MPPTs (V)
- Internal temperature (ºC)
- Conversion components temperature (ºC)
- Inverter failure signals
It should be noted that the precision of inverter-integrated measurements is not always documented by the manufacturers and can be imprecise. For example, energy or AC power measurements taken by inverters may differ substantially from the values recorded by the energy meter. Monitoring systems and reporting should specify and be transparent about the devices used to acquire each measurement.
It is also very useful to have the monitoring system collecting data from all the inverter alarms as they are a valuable source of information for fault detection. Also, low importance alarms or warnings can be used for the organisation of maintenance activities and even setting up Preventive Maintenance actions.
In certain cases, grid connections have limits that must be always respected, such as the maximum AC power that can be injected. For these cases there are two possibilities, one is to set limits using inverter parameters, the second one is to install Power Plant Controller that will change inverter parameters dynamically. In both cases it could be useful to monitor inverter parameters and to program alarms so that the O&M service provider is notified when there is a parameter that has been changed wrongly and does not respect a given limit.
Best practice dictates that the sample size for the measurement of inverter-based variables is 15 minutes at one minute interval. For ad-hoc performance analysis purposes such as allowing the analysis of solar PV array performance, root cause analysis or possible MPP-tracking problems, the input DC voltage and current need to be measured and stored separately.
In general, and as best practice, all common inverter parameters should be logged by the data loggers, since there are a lot of additional important parameters, such as internal temperature, and isolation level, etc. that could be useful for O&M services.
Inverters should be capable of detecting when their conversion components are overheating, to protect themselves under extreme or abnormal operating conditions. Therefore, it is advisable to record the temperature as provided by the inverter so that ventilation performance can be assessed.
Energy meter
One of the most important features of a monitoring system is the automated collection of energy meter data with a granularity of up to 15 minutes. Gathering energy meter data is required for invoicing purposes but it is also the best reference for measuring energy and calculating plant PR and Yield. It is also much more accurate than using inverter data.
Using a high accuracy energy meter to measure energy produced and consumed by the plant is normally required by the Utility. When this is not the case it is a best practice to install a meter with a maximum uncertainty of ± 0.5%, especially for plants > 100 kWp.
To allow data acquisition via the monitoring system, it is recommended to have a meter with two communication bus ports as well as Automatic Meter Reading (AMR) service from the Utility or Meter Operator.
For meters that can store historical data it is a best practice to have a Monitoring System capable of retrieving historical data to avoid any production data loss in case of Monitoring System outages.
Control settings
It is important to monitor all control settings of the plant at inverter- and grid injection-level (if available). Many plants apply control settings for local grid regulation (injection management) or optimisation of the market value of the solar PV generation portfolio (remote control). These settings need to be monitored for contractual reporting reasons and performance assessment.
Alarms
As a minimum requirement, the Monitoring System shall be able to generate the following alarms and, at the user’s discretion, send them by email:
· Loss of communication
· Plant stops
· Inverter stops
· Plant with Low Performance
· Inverter with Low Performance (e.g., due to overheating)
As best practice, the following alarms will also be sent by the monitoring system:
· String without current
· Plant under operation
· Discretion Alarm
· Alarm Aggregation
As a best practice, the following alarms should also be tracked by the O&M service provider. However, these alarms are sent by separate systems:
· Intrusion detection
· Fire alarm detection
The above lists are not exhaustive. For a comprehensive overview of recommended functionalities, refer to the Monitoring Checklist of the Solar Best Practices Mark.
AC circuit / Protection relay
Monitoring the status of MV switch gear and important LV switches through digital inputs is recommended. Whenever possible, it can also be useful to read and register the alarms generated by the protection relay control unit via communication bus.
Data collected by specialised solar PV module field inspections
Not all types of data are collected automatically through the monitoring system. Certain data are collected via on-site measurements and field inspections manually or with aerial inspections.
solar PV modules are engineered to produce electricity for 25-30 years and nowadays are being deployed in ever more and ever larger solar PV power plants. Quality assurance is the cornerstone for long-term reliability and maximising financial and energy returns. This makes tracking down the source of failures once modules have been installed vital. For that reason, field technical inspections, such as infrared (IR) thermography, electroluminescence (EL) imaging and I-V curve tracing, are being put into practice to assess the quality and performance of solar PV modules on-site.
Field inspections like these can be part of contractual Preventive Maintenance tasks or could be offered as additional services, triggered by the O&M service provider in cases where, for example, plant underperformance is not clearly understood just by looking at monitoring data.
Infrared thermography (IR)
Infrared (IR) thermographic data provides clear and concise indications about the status of solar PV modules and arrays and are used in both predictive and corrective maintenance.
Depending on its temperature, every object (e.g., a solar PV module) emits varying intensities of thermal radiation. As explained by Max Planck’s theories, this radiation measurement can be exploited for the determination of the actual temperature of objects. Thermal radiation – invisible to the human eye – can be measured using an infrared camera and is presented in the form of a thermal image. If abnormalities in solar PV modules occur, this typically leads to higher electrical resistance and thus a change in temperature of the affected module or cell. Based on the visual form and quantifiable temperature differences over the thermal image of a solar PV module, abnormalities such as hotspots, inactive substrings or inactive modules can be identified.
For thermographic data to be usable, a number of minimum requirements have to be met. Irradiance shall equal a minimum of 600 W/m2 and shall be continuously measured on-site, ideally orthogonally to the module surface. Infrared cameras need to possess a thermal resolution of at least 640 x 512 pixels and a thermal sensitivity of at least 0.04 K. Measurements shall be taken at a distance which ensures that the resolution of the infrared image equals 5 x 5 pixels per solar PV cell. Further requirements are to be found in IEC TS 62446-3 Part 3: Photovoltaic modules and plants – outdoor infrared thermography.
IR thermographic data can be captured with specialised IR thermographic cameras mounted either on manual hand-held devices or on drones. There are significant advantages in time and cost savings, speed and accuracy of data analysis and reporting, and worker health and safety that come with drone-enabled IR thermography as opposed to traditional manual inspection methods. The larger-scale the solar PV asset, the greater the advantages become. For more information, please refer to Chapter 6.6. Advanced Aerial Thermography.
Besides solar PV modules, IR thermography can also be used to inspect other important electrical components of a solar PV power plant, such as cables, contacts, fuses, switches, inverters, and batteries. For more information, see IEC TS 62446-3 Part 3: Photovoltaic modules and plants – outdoor infrared thermography and IEA-PVPS T13-10:2018 report: review on infrared and Electroluminescence imaging for solar PV Field applications.
The use of IR thermography alone is sometimes not enough to reach a conclusive diagnosis on the cause and the impact of certain solar PV module failures. Therefore, it is usually combined with the following complementary field tests.
I-V curve tracing on-site
Measurements of the I-V curve characteristic determine the power, short-circuit current, open-circuit voltage and other relevant electric parameters (shunt and series resistance, fill factor) of single solar PV modules or strings. The shape of the curve provides valuable information for identifying failures and it also provides a quantitative calculation of power losses. A typical outdoors I-V curve measurement setup consists of a portable I-V curve tracer. In combination with an irradiance sensor (a reference cell usually) and a thermometer this can be used to measure the solar PV modules electrical behaviour. As on-site ambient conditions differ greatly from those in a standardised lab, the measured results should be translated into STC.
Electroluminescence (EL) imaging on-site
EL images are typically taken of every module when leaving the factory production line and are a very useful baseline for the health of the module before leaving the factory. An EL image will show cell level imperfections and cracks which are invisible to the naked eye. EL imaging can be used on-site to better understand module quality post installation as well as further investigation following the identification of anomalies by thermography.
During the EL testing a material emits light in response to the passage of an electric current. This is applied in order to It is used to check integrity of solar PV modules. Here, a current flows through the solar PV-active material, and as a result, electrons and holes in the semiconductor recombine. In this process the electrons release their energy as light. EL imaging detects the near infrared radiation (NIR), i.e., wavelengths between 0.75 and 1.4 μm. The EL is induced by stimulating single solar PV modules or strings with a DC current supplied by an external portable power source. The NIR emissions then are detected by a silicon charge-coupled device (CCD) camera.
EL is usually done in a dark environment because the amount of NIR emitted by the solar PV modules is low compared to the radiation emitted by the background light and from the sun. This requires that EL imaging conducted on-site has to be done during the night, while covering the solar PV modules with a tent, or in a purpose-built mobile test lab. A typical setup consists of a modified single-lens reflex (SLR) camera, a tripod, a portable DC power supply and extension cables. Additionally, a high pass edge filter at 0.85 μm may be used to reduce interfering light from other sources. The resolution of the camera should be at least high enough so that the fingers of the solar cells in the module can be clearly identified. The noise of the camera output must be as low as possible (lowest ISO number possible) and the camera should be as steady as possible in order to avoid blurry images. Exposure times of 15 seconds are common.
High volume approaches to EL testing such as using drones are being offered by some niche service providers. See chapter 12 for further information.
Magnetic Field Imaging (MFI)
Magnetic field imaging (MFI) is a new and innovative method for quantitatively analysing flowing electric currents non-destructively, and without contact.
The underlying physics are very simple: every electric current generates a magnetic field. A magnetic field sensor creates an image of this by being moved over the current-carrying component. Strength and direction of the electric current can be inferred from this.
Current-carrying components such as solar cells, modules or batteries have a characteristic current distribution. If components have defects that influence the electrical current distribution significantly, the resulting magnetic field also changes. These changes can be detected by MFI and thus traced back to the defects.
The fields of application are manifold. In solar PV, defects relevant for the operation of solar modules can be detected reliably (Lauch et al, 2018; Patzold et al, 2019). These are, for example, broken connectors or ribbons (see Figure 5), missing solder joints or defective bypass diodes in the junction boxes of the modules.
The advantages of the measurement technique that it is non-destructive, fast, and quantitative (the measurement signal is proportional to the underlying electric current). A disadvantage of using magnetic fields is that the distance to the sample must be in the millimeter range to produce high quality imaging results. The measurement cannot resolve microscopic structures (< 100 µm), yet.
Soiling measurements
The operational efficiency of modules is affected by soiling accumulation. Soiling limits the effective irradiance and, therefore, the output of the solar PV module. Measuring soiling I recommended as it can help optimise cleaning schedules and thus revenues. Several methodologies exist for soiling monitoring, the most basic being human inspections. A widely used soiling measurement method is using ground-based soiling reference modules consisting of a module that remains soiled, a cleaned reference cell, an automatic washing station and measurement electronics. There are several variations using different principles to measure the effect of soiling. Digital solutions for soiling monitoring that are currently under development include the analysis of satellite imagery with remote sensing techniques, machine intelligence algorithms and statistical methods. Possible soiling analyses include taking a swab of the soil to an analytical laboratory to determine its nature (diesel soot; pollen; organic soil; inorganic dust) and the appropriate cleaning solution.
2.1.2. Health and safety
Inspection
A. Data and Monitoring Requirements
In general, monitoring systems should allow follow-up on the energy flows within a solar PV system. In principle, it reports on the parameters that determine the energy conversion chain. These parameters, along with the most important energy measures in terms of yields and losses, are illustrated in Figure 6. These yields and losses are always normalised to installed solar PV power at standard test conditions in kilowatt-peak (kWp) for ease of performance comparison.
All components and different aspects of technical data management and monitoring platforms are described in the following paragraphs. Reference should also be made to the Monitoring Checklist of the Solar Best Practices Mark for a synthesis of the most important best practices and recommendation with respect to these points.[1]

Data loggers
The main purposes of a datalogger are:
· Collecting data of relevant components (inverters, meteorological data, energy meter, string combiners, status signals) with every device registered separately
· Basic alarm functionality (e.g., Field Communication issues, time critical events like AC Off)
· Providing a temporary data backup (in case of missing internet connection)
· Supporting the technicians during commissioning (e.g., checking whether all inverters work and feed-in)
In addition to this, some dataloggers can also provide the following functions:
· Power Plant Controller (Monitoring & Control should be managed by one instance to avoid communication issues regarding concurrent access). The Power Plant Controller can be integrated in the datalogger or can be a separate device using the communication channel of the datalogger or even a separate one with preferential bandwidth
· Solar Energy Trading Interface (control the active power by a third-party instance like energy trader)
As best practice, dataloggers should be selected following a list of criterion by the operating party as listed below. For example, an EPC service provider will choose and install the data logger used to monitor the site. This datalogger should be selected:
· for its compatibility with the inverters and auxiliary equipment present on site. Preference for inverter-agnostic dataloggers
· for any command functionality that may be needed (this is site type and country specific)
· for its connectivity strength to the internet
· for its robustness (longevity of life and durability for the environmental conditions it will be kept in)
· for its cyber security measures (and those of the cloud server to which it is connected), namely the possibility to set up a VPN tunnel at least
· for its capability to store data during internet communication outages
The recording interval (also called granularity) of the datalogging should range from 1 minute to 15 minutes. Within one monitoring environment granularity should be uniform for all the different data collected.
As a minimum requirement, data loggers should store at least one month of data. Historical data should be backed up constantly by sending it to external servers and, after every communication failure, the data logger should automatically send all pending information. Moreover, data transmission should be secure and encrypted. There should also be a logbook to track configuration changes (especially relevant when acting as Power Plant Controller).
As a best practice, the data logger should store a minimum of three months of data locally and a full data backup in the cloud. Moreover, the operation of the data logger itself should be monitored. This should be done remotely and from an independent server, delivering information on the data loggers’ operating status at Operating System (OS) and hardware level. It should also provide alerts to the Operations room in case of failures and communication loss.
Best practice is to have dataloggers and routers constantly monitored by a watchdog device on-site. In case of no response to the control unit, the power supply will be interrupted by the watchdog unit, performing a hard reset on the stopped equipment. In cases where it is not possible to have an external watchdog it can be useful to have an automatic reboot function.
The entire monitoring installation should be protected by an uninterruptable power supply (UPS). This includes data loggers, network switches, internet modems/routers, measurement devices and signal converters.
Data Quality & Curation
The main purpose of the monitoring system is to collect data from all the relevant components (energy meters, meteorological sensors, inverters, string combiner boxes, etc.) which are typically installed across the field and connected to the plant SCADA through the local network by using various technologies (serial links, cable, fiber, wireless, etc.). Moreover, renewable plants, and solar plants, are often situated in remote environments, and sometimes in harsh places. As such, equipment and systems are subject to difficult conditions and are often subject to data quality issues.
The data quality issues that equipment may face may be categorised as follow:
· False negative values
· Outliers
· Spikes
· Data gaps
· Junk values
These data quality issues can provoke situations that vary extremely depending on the plant, type of measurement, or systems in place. As such, it is very difficult to implement an overall and systematic data quality strategy for renewable Asset Owners as each case is unique.
The data quality issues mentioned above are obvious and may impact many KPIs which are calculated on this basis. More challenging to identify, are slight and progressive data deviations overtime.
Biased KPIs lead to unnecessary operations costs (unrequired on-site intervention) and performances losses, as defects may remain undetected.
As a best practice, the monitoring solution and system should be capable of filtering these values in the most automated and personalised way to cater for each specific case.
Most effective techniques for data validation are based on the analysis of data over relatively long timespans (i.e., daily data validation), with a granularity between 1 and 15 minutes.
Monitoring (web) portal
The main purposes of the monitoring portal are:
· Reading any type of raw data coming from any type of data logger or other solar PV platforms with no preference on brands or models
· Creating a long-term archive for all raw data provided by the asset
· Modelling each solar PV asset using all available information regarding the actual set up and devices (type of devices, installation/replacement date, modules-string-inverter system layout, modules inclination, orientation, type of installation etc.)
· Visualising aggregated data in the highest possible granularity (1 to 15 min is a best practice for most of the indicators)
· Visualising data in standard and specific diagrams
· Computing and visualising dashboards and views of KPIs. For the list of indicators to be computed, see Chapter 10. Indicators computational inputs might be selectable by the user
· Validating data quality (e.g., through calculation of data availability)
· Detecting malfunctions as well as long term degradations with customisable alarms
· Handling alerts from field devices like dataloggers or inverters
· Calculating typical KPIs (such as PR and Availability) with the possibility to adapt parameters
· Providing consistent and easy to use aggregated KPIs for customisable reports for single plants and portfolios
· Making data available via a standardised interface for use in other systems
The monitoring portal should fulfil the following minimum requirements:
· Accessibility level of at least 99% across the year
· Interface and/or apps dedicated to use cases (on-site service, investor etc)
· Customisable user Access Level
· Graphs of irradiation, energy production, performance, and yield
· Downloadable tables with all the registered figures
· Alarms register
As best practice, the following features will also be included in the Monitoring Portal:
· Configurable User Interface to adjust the views depending on the target group (e.g., O&M service provider, EPC service provider, Investor, Asset Manager)
· User configurable alarms
· User configurable reports
· Ticket system to handle alarm messages
· Plant specific KPIs
· Integrate Third Party Data (e.g., solar power forecast, meteorological data, satellite data for irradiance)
· Granularity of data should be adaptable for downloads of figures and tables
The above lists are not exhaustive. For a comprehensive overview of recommended functionalities, refer to the Monitoring Checklist of the Solar Best Practices Mark.[3]
Data format
The data format of the recorded data files must respect standards such as IEC 61724 and must be clearly documented. Data loggers should collect all inverter alarms in accordance with original manufacturer’s format so that all available information is obtained.
Configuration
The configuration of the monitoring systems and data loggers needs to reflect the actual layout of plant details (hardware brand, model, installation details such as orientation, wiring losses, set up date, etc.) to better perform expected performances simulations and obtain consistent insight about a plant’s actual status. If this has not been done during the plant’s construction phase, it should be done at the commissioning phase or when a new O&M service provider takes over (recommissioning of the monitoring system).
During commissioning, each single piece equipment monitored should be checked to make sure it is properly labelled in the Monitoring System. This can be done by temporarily covering insolation sensors or switching off others such as string boxes or inverters.
It is best practice to have a Monitoring System capable of reading and recording all IDs from all sensors and equipment it monitors. This will reduce the possibility of mislabelling elements and improve the tracing of equipment and sensor replacement during the life of the facility. Some Monitoring Systems have even an auto-configuration feature (plug-and-play) that reduces start-up time and potential mistakes. This it is done by automatically capturing device IDs and configuration information. This also allows for automatic detection of inverter or sensor replacement.
Interoperability
As a best practice, the system should ensure open data accessibility (both for sending and receiving data bilaterally) to enable easy transition and communication between monitoring platforms. Table 6 shows some examples of data integration options. Due to the lack of unifying standards, every Monitoring System provider has their own method of storing and retrieving data. The best systems can retrieve data by using open interfaces such as RESTful, providing interoperability between different systems.
Another important aspect of interoperability is the ability to aggregate data from different platforms that serve a range of areas in the solar PV business, such as administration, accountancy, planning & on-site intervention, and stock management applications. This way, information can be exploited by the central monitoring platform without affecting the external applications. For example, an O&M service provider works with several types of ticketing systems for different clients. The monitoring platform should be able to collect data from all of them. Likewise, information about tickets managed from the central monitoring system should be automatically transferable to the dedicated ticketing application.

Internet connection and Local Area Network
The O&M service provider should make sure to provide the best possible network connectivity. As a minimum requirement, the bandwidth needs to be adequate enough to transfer data in a regular way.
Whenever a fibre connection is available within the solar PV-site area, this should be used to connect to the internet, with industrial routers considered as standard. Where a fibre connection is unavailable, 4G or Wi-Fi communication is preferred. Satellite connection is the least preferred communication type. An additional back-up system is best practice. Any subscription should allow for the data quantity required and should foresee the amount (e.g., Closed-Circuit Television (CCTV) or not)granularity of the data.
For solar PV power plants larger than 1MW it is advised to have a WAN connection and as an alternative to an industrial router, that allows for mobile or satellite communication back-up in case the WAN connection fails. A system with a reset capability in case of loss of internet connection is recommended. A direct connection to a monitoring server with an SLA guarantees continuous data access. If data passes via alternative monitoring servers without an SLA, (e.g., monitoring portal of the inverter manufacturer), the SLA can no longer be guaranteed. The automatic firmware updates of the data logger should be disabled. Firmware updates are subject to a change management procedure with the monitoring service.
All communication cables must be shielded. Physical distances between (DC or AC) power cables and communication cables should be ensured, and communication cables should be shielded from direct sunlight. Furthermore, cables with different polarities must be clearly distinguishable (label or colour) for avoiding polarity connection errors.
Pros and cons of different types of monitoring connections:
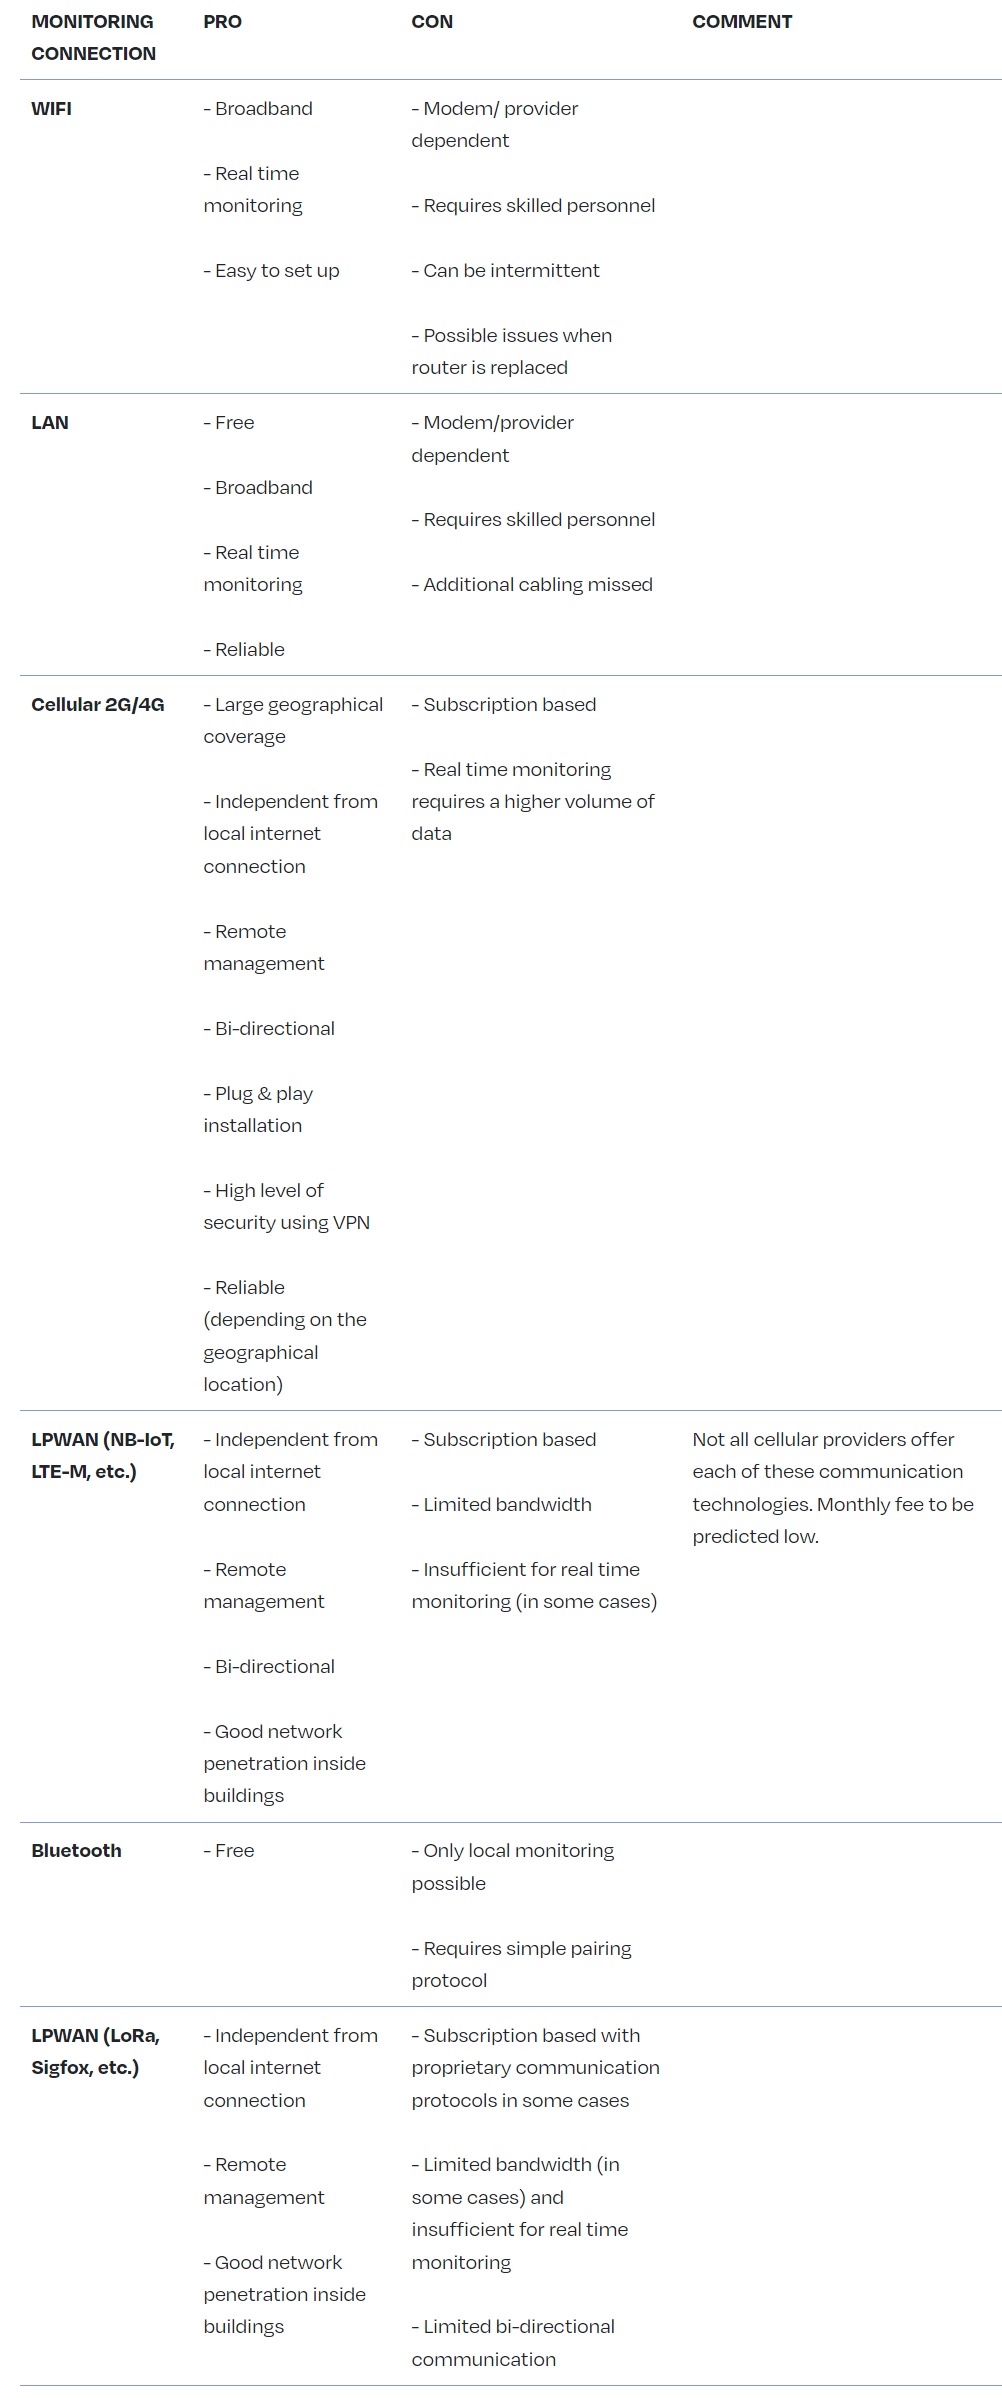
Data ownership and privacy
The data from the monitoring system and data loggers, even if hosted in the cloud, should always be owned by and accessible to the Asset Owner (or SPV). Stakeholders such as the O&M service provider and the Asset Manager need the data to perform their duties and should be granted access. In addition to this, auditors working in the due diligence phases of a project should also have access. It is important to have at least two access levels (read-only, full access).
The monitoring system hardware can be provided by the O&M service provider or a third-party monitoring service provider (but the monitoring system hardware remains the property of the Asset Owner as part of the installation):
· If the O&M service provider is the monitoring service provider, they have full responsibility for protecting and maintaining the data, and ensuring the proper functioning of the monitoring system
· Where there is a third-party monitoring service provider, responsibility for protecting and maintaining the data resides with them. The O&M service provider should endeavours to make sure performance monitoring is correct and takes the best practices mentioned in the previous paragraphs into consideration. The O&M service provider’s ability to properly maintain and use the monitoring system should be evaluated. If necessary, the O&M service provider should be appropriately trained to use the monitoring system. Data use by third-party monitoring providers should be extremely limited, i.e., for correcting bugs and developing additional functions to their systems.
Cybersecurity
As solar PV power plants have inverters and power plant controllers (and monitoring systems) that are connected to the internet to enable surveillance and remote instructions by operators, there are significant cybersecurity risks.
Cybersecurity comprises technologies, processes and controls that are designed to protect systems, networks, and data from cyber-attacks. Effective cyber security reduces the risk of cyber-attacks and protects organisations and individuals from the unauthorised exploitation of systems, networks, and technologies.[4]
Cybersecurity is a vast area and multiple measures are possible. The following hints may help as a starting point:
· Keep it simple: If possible, reduce the type of network devices to a minimum
· As a recommendation, traffic of the network devices may be monitored to detect abnormally high use of bandwidth
· Secure physical access to the network devices and implement a secure password policy. Avoid the use of standard passwords and change all factory setting passwords
· Control access from Internet via strict firewall rules:
- Port forwarding should not be used because this is a big security gap. Only router ports that are necessary should be opened
- Reduce remote access to the necessary use cases
- The use of VPNs (Virtual Private Networks – a secure connection built up from the inside of the private network) is necessary
- VPN access to the site from outside is a minimum requirement
- A VPN server or VPN service which works without requiring a public IP on-site is preferred
- Each solar PV power plant should have different passwords
- Keep your documentation up to date to be sure that no device has been forgotten
- Use different roles to the extent possible (e.g., read only user, administration access)
- Use professional (industrial grade) hardware; only this hardware provides the security and administration functions your plant needs to be secure
· Implement vulnerability management (i.e., identifying and fixing or mitigating vulnerabilities, especially in software and firmware):
- Improve insecure software configurations
- The firmware and software of devices should be kept up to date
- Use anti-virus software if possible and keep it up to date
- Avoid wireless access if it is not necessary
- Audit your network with the help of external experts (penetration tests)
· Keep your company safe:
- Do not store passwords in plain text format, use password manager (e.g., 1Password, Keepass, etc.)
- Train your employees on IT security awareness
- Do not share access from all plants to all employees. Give access only to those who need it. This way damage can be limited if an individual employee is hacked
- Management of leaving and moving employees; change passwords of plants which are overseen by an employee who has left the company or moved to another department
It is therefore best practice that installations undertake a cyber security analysis, starting from a risk assessment (including analysis at the level of the system architecture) and implement a cybersecurity management system (CSMS) that incorporates a plan-do-check-act cycle. The CSMS should start from a cybersecurity policy, and definition of formal cybersecurity roles and responsibilities, and proceed to map this onto the system architecture in terms of detailed countermeasures applied at identified points (e.g., via analysis of the system in terms of zones and conduits). These will include the use of technical countermeasures such as firewalls, encrypted interfaces, authorisation and access controls, and audit/detection tools. They will also include physical and procedural controls, for example, to restrict access to system components and to maintain awareness of new vulnerabilities affecting the system components.
As a minimum requirement, data loggers should not be accessible directly from the internet or should at least be protected via a firewall. Secure and restricted connection to data servers is also important.
The manufacturer of the datalogger and the monitoring platform should provide information on penetration tests for their servers, any command protocol activation channels, and the results of security audits for their products. Command functions should be sent using a secure VPN connection to the control device (best practice). Double authentication would be an even more secure option.
For further information, beyond the scope of this document, please look at the EU Cybersecurity Act (EC, 2019) and the European Parliament’s study “Cyber Security Strategy for the Energy Sector” (EP, 2016).
Types of data collected through the monitoring system
Irradiance measurements
Irradiance Sensors
Solar irradiance in the plane of the solar PV array (POA) is measured on-site by at least one irradiance Class A quality measurement device and ISO 9060:2018 (ISO 9060 2018). The higher the quality of the pyranometer, the lower the uncertainty will be. Best practice is to apply at least two pyranometers in the plane of the solar PV array. In case of different array orientations within the plant, at least one pyranometer is required for each orientation. It should be ensured that the pyranometers are properly assigned to the different arrays for the calculation of PR and Expected Yield.
Class A Pyranometers are preferred over silicon reference cells because they allow a direct comparison between the measured performance of the solar PV power plant and the performance figures estimated in the energy yield assessment. For plants in Central and Western Europe, measuring irradiance with silicon cells yields approximately 2 to 4% higher long-term PR than with a thermopile pyranometer (N. Reich et al. 2012).
Irradiance sensors must be placed in the least shaded location. They must be mounted and wired in accordance with manufacturers’ guidelines. Preventive Maintenance and calibration of the sensors must follow the manufacturers’ guidelines.
The irradiance should be recorded with a granularity of up to 15 minutes (minimum requirement).
Further information on the categorisation of plant sizes and the use of appropriate measuring technology is provided in IEC 61724-1.
Satellite-based Irradiance Measurements
In addition to irradiance sensors, complementary irradiance data from a high-quality satellite-based data service can be acquired after a certain period to perform comparisons with data from ground-based sensors. This is especially useful in case of data loss or when there is low confidence in the data measured onsite by the Monitoring System and it can be considered as best practice. In particular, high-quality satellite-based data should be used for irradiation sensor data quality assessments. The longer the period considered the lower the error will be for satellite-based irradiation data. For daily irradiation values, the error is relatively high, with root-mean-square error (RMSE) values of 8 to 14% in Western Europe. For monthly and annual values, it decreases below 5 and 3%, respectively, which is in line with an on-site sensor (Richter et al. 2015).
When satellite-based irradiance data is used, hourly granularity or less (15 minutes if possible) is recommended. The data must be retrieved once per day at least.
Module temperature measurements
Module temperature can be measured for performance analysis in KPIs such as the temperature-corrected PR.
The accuracy of the temperature sensor, including signal conditioning and acquisition done by the monitoring system hardware, should be < ±1 °C.
The temperature sensor should be attached to the middle of the backside of the module in the middle of the array table, in the centre of a cell, away from the junction box with appropriate and stable thermally conductive glue (Woyte et al. 2013). The installation should be in accordance with manufacturer guidelines (e.g., respecting cabling instructions towards the data logger).
Varying solar PV module temperature in a plant is mainly due to different wind exposure. Therefore, in large plants more sensors will be required across the site because module temperature should be measured at different representative positions (e.g., for modules in the centre of the plant and for modules at edge locations where temperature variation is expected).
The granularity of module temperature data should be at least 15 minutes to perform a correct PR calculation.
Local meteorological data
It is best practice to measure ambient temperature, wind speed, rain fall and other site relevant meteorological measurement with the installation of a local meteorological station in accordance with the manufacturers’ guidelines. Ambient temperature is measured with a shielded thermometer, such as a PT100. The shield protects the sensor from radiative heat transfer. Wind speed is measured with an anemometer, at 10m above ground level.
Wind and ambient temperature data are normally not required for calculating PR unless this is a contractual requirement/agreement (e.g., according to specific recommendations such as those from the National Renewable Energy Laboratory in the USA). However, they are required when the solar PV power plant is modelled in operation or retrospectively.
Additionally, whenever the module temperature measurements are not available or not suitable, wind speed and ambient temperature coupled with installation specifications can be used to retrieve a good estimation of module temperature. In this case, 15 minutes granularity of measurement is still the best practice.
For plants larger than 10 MWp, having automated collection of hourly meteorological data (ambient temperature, wind speed, snow coverage, rainfall) from independent sources is recommended. The reason for this is that on-site meteorological stations are subject to local phenomena and installation-specific results. Data from an independent weather-station is less subject to this, while being also more stable and robust with respect to long-term drift. They can therefore be used to evaluate the quality, and eventually replace, the on-site measurement.
Therefore, for both performance assessment and detailed analysis purposes, automated, local meteorological data is recommended. However, for performance assessment the most important measurement remains the in-plane irradiation (see Chapter 10. Key Performance Indicators).
Solar resource data derived from satellite image processing is available from several services at a nominal per-site and per time-segment (such as one week) fee. The measurement error in satellite data might be greater than that of an on-site instrument but is often more reliable than a mis-aligned, inadequate or dirty on-site pyranometer, and less susceptible to soiling or tampering.
String measurements
Individual string current measurements may be deployed when not supported by the inverters. String level monitoring allows for more precise trouble-shooting procedures than at inverter level. Depending on the module technology used in a plant, strings can be combined (in harnesses) which can help reduce operation costs.
To detect problems quickly and to increase plant uptime, installing string monitoring equipment is recommended. This will constantly measure the current of every string and register those measurements in intervals of up to at 15 minutes. To reduce costs, the current sensor can be used to measure more than one string. However, no more than two strings should be measured in parallel.
Inverter measurements
Inverters have a large set of variables that are constantly measured by their hardware, and that can be registered and investigated from the monitoring system. The data sent from the inverter to the monitoring system should be in cumulative values to allow the monitoring of the overall electricity generation of the inverter, even in case of outages of the monitoring system.
Recommended variables to be monitored are:
- Cumulative Energy generated (kWh)
- Instant Active Power injected (kW)
- Instant Reactive Power injected (kVAr)
- Instant Apparent Power injected (kVA)
- AC Voltage per each phase (V)
- AC Current per each phase (A)
- Power Factor / Cos Phi
- Frequency for each phase (Hz)
- Instant DC Power for each MPPT (kW)
- Instant DC Current for each MPPT (A)
- Instant DC Voltage for each MPPT (V)
- Total instant DC Power for all MPPTs (kW)
- Total instant DC Current for all MPPTs (A)
- Average instant DC Voltage for all MPPTs (V)
- Internal temperature (ºC)
- Conversion components temperature (ºC)
- Inverter failure signals
It should be noted that the precision of inverter-integrated measurements is not always documented by the manufacturers and can be imprecise. For example, energy or AC power measurements taken by inverters may differ substantially from the values recorded by the energy meter. Monitoring systems and reporting should specify and be transparent about the devices used to acquire each measurement.
It is also very useful to have the monitoring system collecting data from all the inverter alarms as they are a valuable source of information for fault detection. Also, low importance alarms or warnings can be used for the organisation of maintenance activities and even setting up Preventive Maintenance actions.
In certain cases, grid connections have limits that must be always respected, such as the maximum AC power that can be injected. For these cases there are two possibilities, one is to set limits using inverter parameters, the second one is to install Power Plant Controller that will change inverter parameters dynamically. In both cases it could be useful to monitor inverter parameters and to program alarms so that the O&M service provider is notified when there is a parameter that has been changed wrongly and does not respect a given limit.
Best practice dictates that the sample size for the measurement of inverter-based variables is 15 minutes at one minute interval. For ad-hoc performance analysis purposes such as allowing the analysis of solar PV array performance, root cause analysis or possible MPP-tracking problems, the input DC voltage and current need to be measured and stored separately.
In general, and as best practice, all common inverter parameters should be logged by the data loggers, since there are a lot of additional important parameters, such as internal temperature, and isolation level, etc. that could be useful for O&M services.
Inverters should be capable of detecting when their conversion components are overheating, to protect themselves under extreme or abnormal operating conditions. Therefore, it is advisable to record the temperature as provided by the inverter so that ventilation performance can be assessed.
Energy meter
One of the most important features of a monitoring system is the automated collection of energy meter data with a granularity of up to 15 minutes. Gathering energy meter data is required for invoicing purposes but it is also the best reference for measuring energy and calculating plant PR and Yield. It is also much more accurate than using inverter data.
Using a high accuracy energy meter to measure energy produced and consumed by the plant is normally required by the Utility. When this is not the case it is a best practice to install a meter with a maximum uncertainty of ± 0.5%, especially for plants > 100 kWp.
To allow data acquisition via the monitoring system, it is recommended to have a meter with two communication bus ports as well as Automatic Meter Reading (AMR) service from the Utility or Meter Operator.
For meters that can store historical data it is a best practice to have a Monitoring System capable of retrieving historical data to avoid any production data loss in case of Monitoring System outages.
Control settings
It is important to monitor all control settings of the plant at inverter- and grid injection-level (if available). Many plants apply control settings for local grid regulation (injection management) or optimisation of the market value of the solar PV generation portfolio (remote control). These settings need to be monitored for contractual reporting reasons and performance assessment.
Alarms
As a minimum requirement, the Monitoring System shall be able to generate the following alarms and, at the user’s discretion, send them by email:
· Loss of communication
· Plant stops
· Inverter stops
· Plant with Low Performance
· Inverter with Low Performance (e.g., due to overheating)
As best practice, the following alarms will also be sent by the monitoring system:
· String without current
· Plant under operation
· Discretion Alarm
· Alarm Aggregation
As a best practice, the following alarms should also be tracked by the O&M service provider. However, these alarms are sent by separate systems:
· Intrusion detection
· Fire alarm detection
The above lists are not exhaustive. For a comprehensive overview of recommended functionalities, refer to the Monitoring Checklist of the Solar Best Practices Mark.[5]
AC circuit / Protection relay
Monitoring the status of MV switch gear and important LV switches through digital inputs is recommended. Whenever possible, it can also be useful to read and register the alarms generated by the protection relay control unit via communication bus.
Data collected by specialised solar PV module field inspections
Not all types of data are collected automatically through the monitoring system. Certain data are collected via on-site measurements and field inspections manually or with aerial inspections.
solar PV modules are engineered to produce electricity for 25-30 years and nowadays are being deployed in ever more and ever larger solar PV power plants. Quality assurance is the cornerstone for long-term reliability and maximising financial and energy returns. This makes tracking down the source of failures once modules have been installed vital. For that reason, field technical inspections, such as infrared (IR) thermography, electroluminescence (EL) imaging and I-V curve tracing, are being put into practice to assess the quality and performance of solar PV modules on-site.
Field inspections like these can be part of contractual Preventive Maintenance tasks or could be offered as additional services, triggered by the O&M service provider in cases where, for example, plant underperformance is not clearly understood just by looking at monitoring data.
Infrared thermography (IR)
Infrared (IR) thermographic data provides clear and concise indications about the status of solar PV modules and arrays and are used in both predictive and corrective maintenance.
Depending on its temperature, every object (e.g., a solar PV module) emits varying intensities of thermal radiation. As explained by Max Planck’s theories, this radiation measurement can be exploited for the determination of the actual temperature of objects. Thermal radiation – invisible to the human eye – can be measured using an infrared camera and is presented in the form of a thermal image. If abnormalities in solar PV modules occur, this typically leads to higher electrical resistance and thus a change in temperature of the affected module or cell. Based on the visual form and quantifiable temperature differences over the thermal image of a solar PV module, abnormalities such as hotspots, inactive substrings or inactive modules can be identified.
For thermographic data to be usable, a number of minimum requirements have to be met. Irradiance shall equal a minimum of 600 W/m2 and shall be continuously measured on-site, ideally orthogonally to the module surface. Infrared cameras need to possess a thermal resolution of at least 640 x 512 pixels and a thermal sensitivity of at least 0.04 K. Measurements shall be taken at a distance which ensures that the resolution of the infrared image equals 5 x 5 pixels per solar PV cell. Further requirements are to be found in IEC TS 62446-3 Part 3: Photovoltaic modules and plants – outdoor infrared thermography.
IR thermographic data can be captured with specialised IR thermographic cameras mounted either on manual hand-held devices or on drones. There are significant advantages in time and cost savings, speed and accuracy of data analysis and reporting, and worker health and safety that come with drone-enabled IR thermography as opposed to traditional manual inspection methods. The larger-scale the solar PV asset, the greater the advantages become. For more information, please refer to Chapter 6.6. Advanced Aerial Thermography.
Besides solar PV modules, IR thermography can also be used to inspect other important electrical components of a solar PV power plant, such as cables, contacts, fuses, switches, inverters, and batteries. For more information, see IEC TS 62446-3 Part 3: Photovoltaic modules and plants – outdoor infrared thermography and IEA-PVPS T13-10:2018 report: review on infrared and Electroluminescence imaging for solar PV Field applications.
The use of IR thermography alone is sometimes not enough to reach a conclusive diagnosis on the cause and the impact of certain solar PV module failures. Therefore, it is usually combined with the following complementary field tests.
I-V curve tracing on-site
Measurements of the I-V curve characteristic determine the power, short-circuit current, open-circuit voltage and other relevant electric parameters (shunt and series resistance, fill factor) of single solar PV modules or strings. The shape of the curve provides valuable information for identifying failures and it also provides a quantitative calculation of power losses. A typical outdoors I-V curve measurement setup consists of a portable I-V curve tracer. In combination with an irradiance sensor (a reference cell usually) and a thermometer this can be used to measure the solar PV modules electrical behaviour. As on-site ambient conditions differ greatly from those in a standardised lab, the measured results should be translated into STC.
Electroluminescence (EL) imaging on-site
EL images are typically taken of every module when leaving the factory production line and are a very useful baseline for the health of the module before leaving the factory. An EL image will show cell level imperfections and cracks which are invisible to the naked eye. EL imaging can be used on-site to better understand module quality post installation as well as further investigation following the identification of anomalies by thermography.
During the EL testing a material emits light in response to the passage of an electric current. This is applied in order to It is used to check integrity of solar PV modules. Here, a current flows through the solar PV-active material, and as a result, electrons and holes in the semiconductor recombine. In this process the electrons release their energy as light. EL imaging detects the near infrared radiation (NIR), i.e., wavelengths between 0.75 and 1.4 μm. The EL is induced by stimulating single solar PV modules or strings with a DC current supplied by an external portable power source. The NIR emissions then are detected by a silicon charge-coupled device (CCD) camera.
EL is usually done in a dark environment because the amount of NIR emitted by the solar PV modules is low compared to the radiation emitted by the background light and from the sun. This requires that EL imaging conducted on-site has to be done during the night, while covering the solar PV modules with a tent, or in a purpose-built mobile test lab. A typical setup consists of a modified single-lens reflex (SLR) camera, a tripod, a portable DC power supply and extension cables. Additionally, a high pass edge filter at 0.85 μm may be used to reduce interfering light from other sources. The resolution of the camera should be at least high enough so that the fingers of the solar cells in the module can be clearly identified. The noise of the camera output must be as low as possible (lowest ISO number possible) and the camera should be as steady as possible in order to avoid blurry images. Exposure times of 15 seconds are common.
High volume approaches to EL testing such as using drones are being offered by some niche service providers.
Magnetic Field Imaging (MFI)
Magnetic field imaging (MFI) is a new and innovative method for quantitatively analysing flowing electric currents non-destructively, and without contact.
The underlying physics are very simple: every electric current generates a magnetic field. A magnetic field sensor creates an image of this by being moved over the current-carrying component. Strength and direction of the electric current can be inferred from this.
Current-carrying components such as solar cells, modules or batteries have a characteristic current distribution. If components have defects that influence the electrical current distribution significantly, the resulting magnetic field also changes. These changes can be detected by MFI and thus traced back to the defects.
The fields of application are manifold. In solar PV, defects relevant for the operation of solar modules can be detected reliably (Lauch et al, 2018; Patzold et al, 2019). These are, for example, broken connectors or ribbons (see Figure 7), missing solder joints or defective bypass diodes in the junction boxes of the modules.

The advantages of the measurement technique that it is non-destructive, fast, and quantitative (the measurement signal is proportional to the underlying electric current). A disadvantage of using magnetic fields is that the distance to the sample must be in the millimeter range to produce high quality imaging results. The measurement cannot resolve microscopic structures (< 100 µm), yet.
Soiling measurements
The operational efficiency of modules is affected by soiling accumulation. Soiling limits the effective irradiance and, therefore, the output of the solar PV module. Measuring soiling I recommended as it can help optimise cleaning schedules and thus revenues. Several methodologies exist for soiling monitoring, the most basic being human inspections. A widely used soiling measurement method is using ground-based soiling reference modules consisting of a module that remains soiled, a cleaned reference cell, an automatic washing station and measurement electronics. There are several variations using different principles to measure the effect of soiling. Digital solutions for soiling monitoring that are currently under development include the analysis of satellite imagery with remote sensing techniques, machine intelligence algorithms and statistical methods. Possible soiling analyses include taking a swab of the soil to an analytical laboratory to determine its nature (diesel soot; pollen; organic soil; inorganic dust) and the appropriate cleaning solution.
B. Key Performance Indicators
The Key Performance Indicators (KPIs) provide the Asset Owner with a quick reference on the performance of the solar PV power plant. The KPIs in this section are divided into the following categories:
· Solar PV power plant KPIs, which directly reflect the performance of a solar PV power plant. They are quantitative indicators.
· O&M service provider KPIs, which reflect the performance of the service provided by the O&M service provider. O&M service provider KPIs are both quantitative and qualitative indicators.
· Solar PV power plant/O&M service provider KPIs, which reflect solar PV power plant performance and O&M service quality at the same time.

The O&M service provider (or the Technical Asset Manager) is generally responsible for the calculation of the KPIs and reporting to the Asset Owner.
It is important to underline that the O&M service provider is not responsible for providing contractual guarantees for all the KPIs listed in this chapter.
When there are warranties in place it is strongly advised that the party liable for the warranties is not the only one calculating the KPIs.
Solar PV power plant data
Solar PV power plant data can be split into two groups:
1. Raw data measurements: data obtained directly from the solar PV power plant and used for performance calculation
2. Solar PV power plant KPIs: using the raw data from the solar PV power plant to give a more balanced overview of its operation
Raw data measurements for performance calculation
The following is a list of raw data measurements that can be used to calculate KPIs:
· AC Apparent Power produced (kVA)
· AC Active Power (kW)
· AC Energy produced (kWh)
· AC Energy metered (kWh)
· Reactive power (kVAR)
· Irradiance[1] (reference for the plant or the sub-plants) (W/m2)
· Air and module temperature (Celsius degrees)
· Alarm, status code and duration
· Outages, unavailability events
This is a basic list, and it is non-exhaustive.
Solar PV power plant KPIs
Calculated KPIs give a more balanced view of the operation of a solar PV power plant as they take into account the different operating conditions for each plant. Suggestions for calculated KPIs, along with relevant formulas, can be found below. These KPIs can be calculated over different time periods, but often they are computed on an annual basis. When comparing different KPIs or different solar PV power plants’ KPIs, it is important to be consistent in the time period used in computation.
Reference Yield
The Reference Yield Yr represents the energy obtainable under standard conditions, with no losses, over a certain period i. It is useful to compare the Reference Yield with the final system yield.
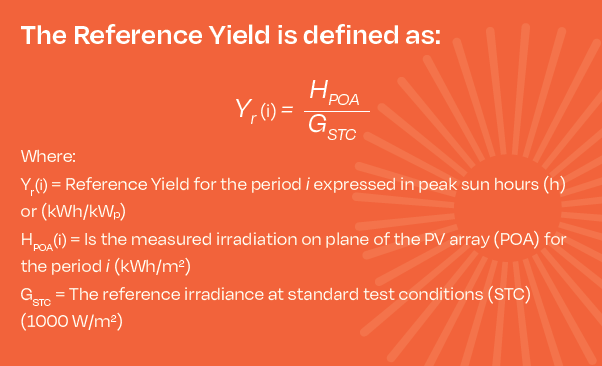
Specific Yield
Specific Yield, also called final yield, Yf is the measure of the total energy generated, normalised per kWp installed, over a certain period i.
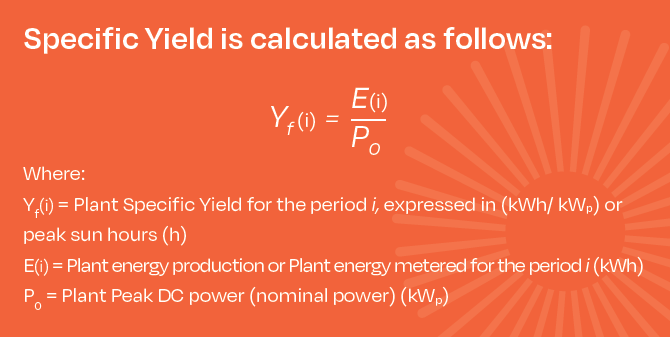
This measurement integrates plant output over a chosen time frame, and since it normalises to nominal power, comparison of the production of plants with different nominal power or even different technologies (e.g., solar PV, wind, biomass etc) is possible. For example, the Specific Yield of a solar PV power plant can be compared against the Specific Yield of a wind plant for the purposes of making an investment decision. Moreover, the Specific Yield of a 5 MWp ground mounted solar PV power plant can be compared directly to that of a 1 MWp double tracker power plant, for example.
Calculating Specific Yield on the inverter level also allows a direct comparison between inverters that may have different AC/DC conversion rates or different nominal powers. Moreover, by checking inverter level Specific Yield within a plant, it is possible to detect whether an inverter is performing worse than others.
Performance Ratio (PR)
PR is a quality indicator of the solar PV power plant. As the ratio between the actual Specific Yield and the theoretically possible Reference Yield, PR captures the overall effect of solar PV system losses when converting from a nameplate DC rating to AC output. Typically, losses result from factors such as module degradation, temperature, soiling, inverter losses, transformer losses, and system and network downtime. The higher the PR is, the more energy efficient the plant is.
PR, as defined in this section, is usually used to report on longer periods of time according to the O&M contract, such as month or year. Based on PR, the O&M service provider can provide recommendations to the plant Owners on possible investments or interventions.
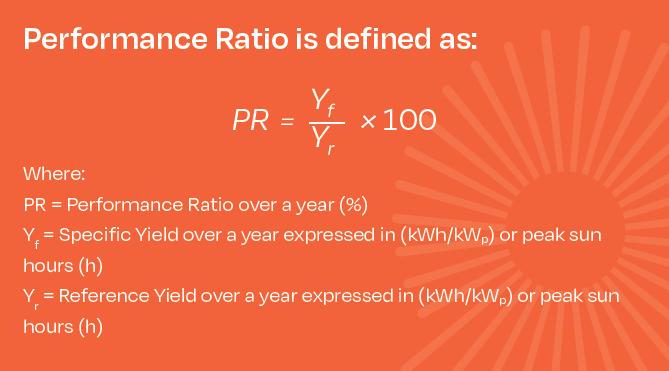
These definitions are based on (Woyte et al. 2014) in line with IEC 61724-1:2017 and are common practice.
PR is measured for available times at the inverter or plant level.
Note that special attention is needed when assessing the PR of overrated plants, where the output of the plant is limited by the inverter’s maximum AC output. In such situations, and for the period that overrating takes place, PR will calculate lower than normal although there is no technical problem with the plant. Stakeholders should be careful assessing PR values for overrated plants, although the amount of overrating is normally statistically constant or with negligible differences on a yearly basis.
Temperature-corrected Performance Ratio
In some situations, such as a commissioning test or solar PV power plant handover from one O&M service provider to another, PR needs to be measured over a shorter period, such as two weeks or a month. In such situations, using a PR formula corrected with temperature factor is recommended. This can help neutralise short-term PR fluctuation due to temperature variations from STC (25°C). As a best practice, temperature should be registered with a granularity of up to 15 minutes (referred to as period j below) and the average temperature for the time period i should be calculated by weighting the mean temperatures of the time periods j according to Specific Yield of this time period.[2]
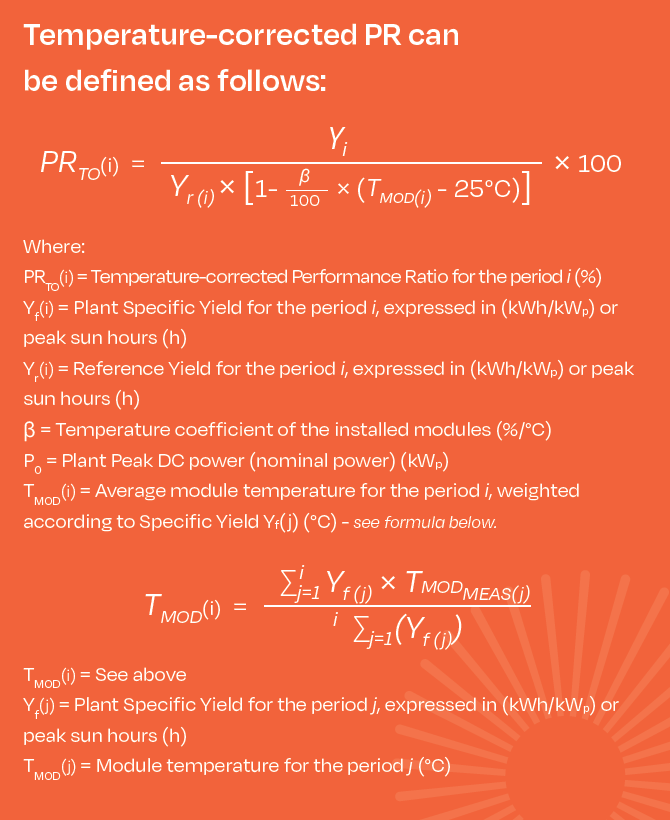
Interpreting Performance Ratio
Careful attention needs to be paid when interpreting PR, because there are several cases where it can provide misleading information about the status of the solar PV power plant:
Seasonal variation of PR (lower PR in the hot months, higher in colder months)
The calculation of PR presented in this section neglects the effect of solar PV module temperature on its power. Therefore, the performance ratio usually decreases with increasing irradiation during a reporting period, even though energy production increases. This is due to an increasing solar PV module temperature that results in lower efficiency. This gives a seasonal variation, with higher PR values in the cold months and lower values in the hot months. It may also give geographic variations between systems installed in different climates.
This seasonal variation of PR can be significantly reduced by calculating a temperature-corrected PR to STC, which adjusts the power rating of the plant at each recording interval to compensate for differences between the actual solar PV module temperature and the STC reference temperature of 25 °C (taking into account the temperature coefficient of the modules, given as % of power loss per °C).
Interpretation of PR for overrated plants (lower PR as designed)
Special attention is needed when assessing the PR of overrated plants. In these plants installed DC power is higher than inverter AC power (DC/AC ratio higher than 1), as a consequence, during sunny periods the output of the plant may be limited by inverter maximum AC output. In such situations, when derating takes place, PR will be lower than normal although there is no technical problem with the plant – lower PR in high-production periods is in fact the consequence of a design decision. Stakeholders should be careful assessing PR values for overrated plants, although the amount of derating is normally statistically constant or with negligible differences on a yearly basis.
Calculation of PR using GHI instead of POA (misleading higher PR)
Calculation of the PR using the Global Horizontal Irradiance (GHI) instead of in-plane (POA) irradiance is an alternative in situations where only GHI measurements are available. The PR calculated with GHI would typically show higher values which may even exceed unity. These values cannot necessarily be used to compare one system to another but can be useful for tracking the performance of a system over time and could also be applied to compare a system’s measured, expected, and predicted performance using a performance model that is based only on GHI.
Soiled irradiance sensors (misleading higher PR)
Special attention is needed when assessing the PR using data from soiled irradiance sensors. In this case, PR will present higher values and will give the false impression that the solar PV power plant is performing better than expected and even some underperformance issues could remain hidden.
Expected Yield
Expected Yield Yexp(i) is the Reference Yield Yr(i) multiplied by the expected PR and thus expresses the Specific Yield that has been expected for a certain period i.
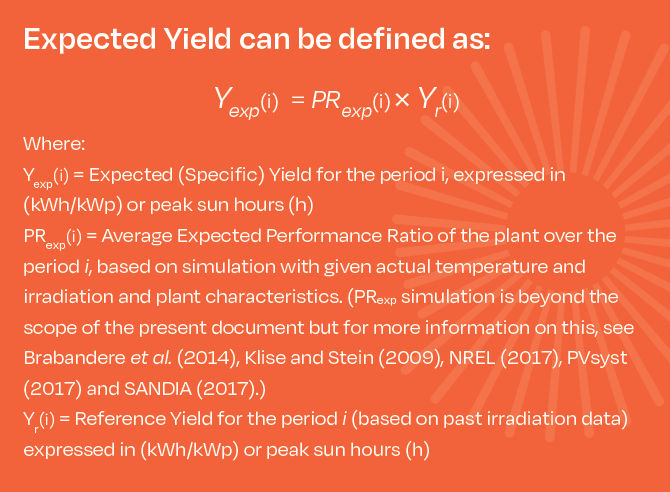
Note that Expected Yield is based on past values of irradiation data. Predicted Yield is based on forecasted data, from day ahead and hour ahead weather reports.
Energy Performance Index
The Energy Performance Index (EPI) is defined as the ratio between the observed Specific Yield Yf(i) and the Expected Yield Yexp(i) as determined by a solar PV model. The EPI is regularly recalculated for the respective assessment period (typically day/month/year) using the actual weather data as input to the model each time it is calculated. This concept was proposed in Honda et al. 2012.
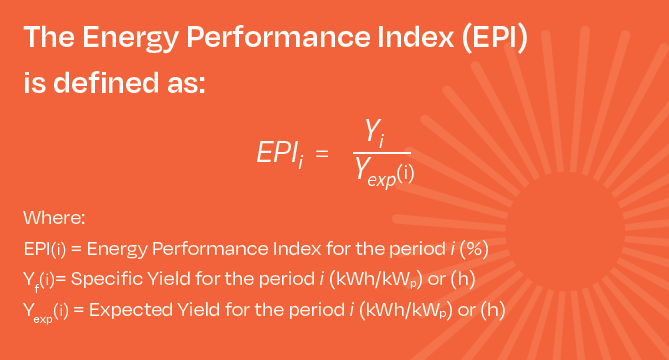
The advantage of using the EPI is that its expected value is 100% at project start-up and is independent of climate or weather. This indicator relies on the accuracy of the model. Unfortunately, there is more than one established model for calculating the Expected Yield of solar PV systems in operation and not all of them are transparent. Therefore, the use of EPI is recommended mainly for the identification of performance flaws and comparison of plants.
Technical Availability or Uptime
Technical Availability (or Uptime), Contractual Availability and Energy-based Availability are three closely related indicators to measure whether the solar PV power plant is generating electricity.
Technical Availability is the parameter that represents the time during which the plant is operating over the total possible time it can operate, without taking any exclusion factors into account. The total possible time is considered as the period when the plant is exposed to irradiation levels above the generator’s Minimum Irradiance Threshold (MIT). Technical Availability is covered extensively in IEC TS 63019:2019.
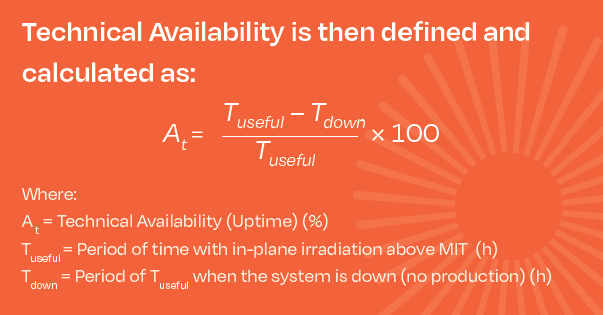
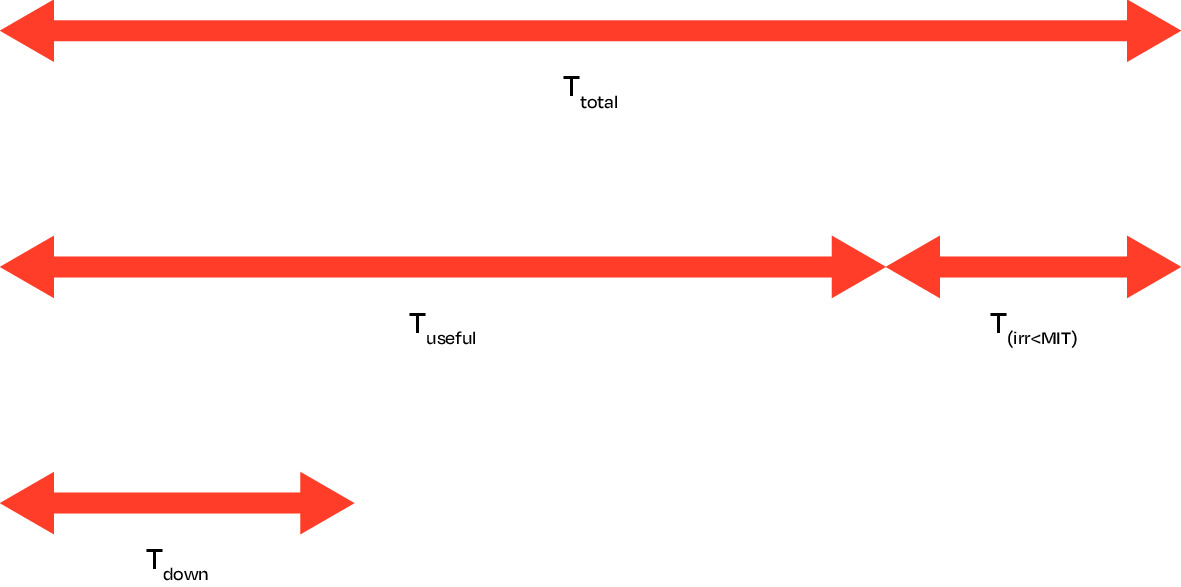
Normally, only the time where irradiance is above the MIT is considered and this is noted above as Tuseful,, where Tuseful = Ttotal – T(irr<MIT). Typical MIT values are 50 or 70 W/m2. MIT should be defined according to site and plant characteristics (e.g. type of inverter, DC/AC ratio etc).
Technical Availability should be measured also at inverter level. Individual inverters’ Technical Availability At_k should be weighted according to their respective installed DC power Pk. In this case, the Technical Availability of the total solar PV power plant At_total with a total installed DC power of P0 can be defined as follows:
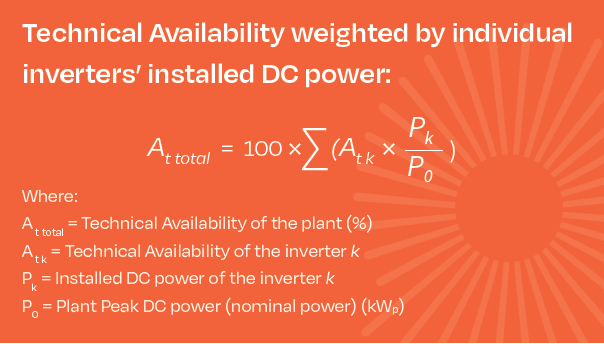
For the calculation of Technical Availability, typically up to 15 minutes of irradiation and power production data should be taken as a basis if granularity of components remains at the level of inverter or higher. Anything below the level of inverter is then captured with the PR calculation presented above.
Technical Tracker Availability or Tracker Uptime
Similar to Technical Availability, Technical Tracker Availability is simply a ratio of the useful time compared to the uptime or downtime of the tracker. This measurement is a purely technical parameter and would not allow for any agreed exclusions in the availability. To calculate the technical tracker availability, the following formula can be used:
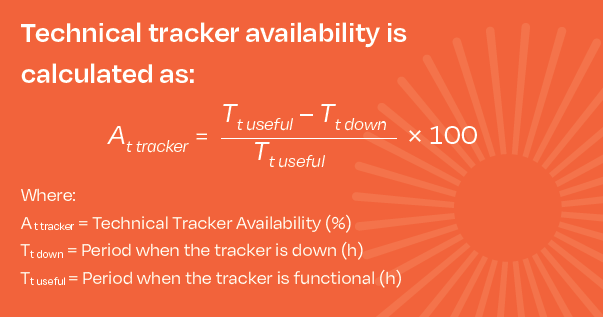
Tracking Performance Availability
Functional failure of a tracker can count as inaccurate, or out of sync tracking compared to the set point. This failure can often lead to shading or small performance deviations, based on the deviation from the sun path. The formula for the tracker’s performance availability is like the technical availability. is defined as the period during which deviation of the tracker’s tilt is higher than the accepted deviation angle. This metric can help to improve single-or dual-axis tracking performance.
O&M service provider KPIs
As opposed to power plant KPIs, which provide the Asset Owner with information about the performance of their asset, O&M service provider KPIs assess the performance of the O&M service.

Acknowledgement Time
The Acknowledgement Time (also called Reaction Time) is the time between detecting the problem (receipt of the alarm or noticing a fault) and the acknowledgement of the fault by the O&M service provider by dispatching a technician. The Acknowledgement Time reflects the O&M service provider’s operational ability.
Intervention Time
The Intervention Time is the time between the acknowledgment of a fault and the arrival of a service technician or a subcontractor at the plant. Intervention Time assesses the capacity of the O&M service provider, and how fast they can mobilise and be on site. It is worth noting that, in certain cases remote repair is possible, or the O&M service provider is not able to repair the fault and third-party involvement is necessary.
Response Time
The Response Time is the Acknowledgement Time plus the Intervention time. Used for contractual purposes, minimum Response Times are guaranteed based on fault classes, classified on the basis of the unavailable power, the consequent potential loss of energy generation, and the relevance of the failure in terms of their safety impact.
Resolution Time
Resolution Time (or Repair Time) is the time taken to resolve a fault, starting from arrival at the solar PV power plant. Resolution Time is generally not guaranteedas resolution often does not fully controlled by the O&M service provider.
Reporting
It is very important for the O&M service provider to comply with reporting requirements and reporting timelines. Content and timing of the reporting is generally agreed by the parties in the Contract agreement. Content of the reporting is expected to be consistent and any change in content or format needs to be explained by the O&M service provider. Delivery of reports per the agreed upon timeline is an important indicator for reliability and process adherence within the O&M service provider’s organisation.
O&M service provider experience
Experience of the O&M service provider with solar PV power plants in a particular country, region, grid environment and/or with solar PV power plants equipped with certain technology or size can play an important role. This is relevant for the selection of the O&M service provider and can be tracked by the Owner over time (track record).
Schedule Attainment
Schedule Attainment (or Schedule Compliance) is the ability of the O&M service provider to execute the Preventive Maintenance schedule within the required timeframes (typically across a period of a week or month).
O&M service providers who adhere to the schedule ensure accomplishing as much preventive maintenance and other timely corrective work as possible. Schedule Attainment provides a measure of accountability.
Low Schedule Attainment can provide key warning signs to the Asset Owner regarding the O&M service provider:
· That preventive maintenance is not done which will lead to equipment failures over time
· The O&M service provider might not have sufficient numbers of qualified technical staff to performance maintenance
· The O&M service provider systems such as the management of stores and spares, procurement processes are not effective
· There may be high levels of corrective maintenance work – which could be due to unsolved technical issues
Best practice requires > 90%, based on the following formula:

Preventive vs Corrective Maintenance ratio
This metric measures the reactive nature of the plant maintenance work. Asset Owners and AMs prefer a higher proportion of Preventive maintenance than Corrective Maintenance. This indicator is based on the actual hours technicians spend on jobs. The actual hours are measured regardless of the originally estimated hours of the planners.
When the O&M service provider has control over the equipment, the O&M service provider decides when to take certain actions to preserve equipment. When the equipment has control over the O&M service provider, the equipment drives the efforts of maintenance. A more reactive plant environment has more circumstances of the equipment experiencing problems and causing the O&M service provider to break the weekly schedule. A more proactive one experiences few circumstances of sudden equipment problems interrupting scheduled work.
Best practice requires that the ratio of Preventive vs Corrective Maintenance is 80/20.
Solar PV power plant/O&M service provider KPIs
Contractual Availability
Contractual Availability is Technical Availability with certain contractually agreed exclusion factors (see below) applied in the calculation; It is used as a basis for evaluating the general Contractual Availability guarantees provided by the O&M service provider and included in the O&M Contract. A best practice is a Minimum Guaranteed Contractual Availability of 98% over a year.
Contractual Availability is the parameter that represents the time in which the plant is operating over the total possible time it is able to operate, taking into account the number of hours the plant is not operating for reasons contractually not attributable to the O&M service provider (listed below in the same section).
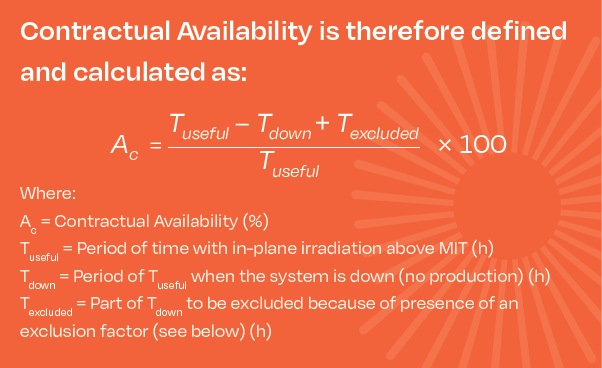
The figure below illustrates the various periods in time mentioned above.
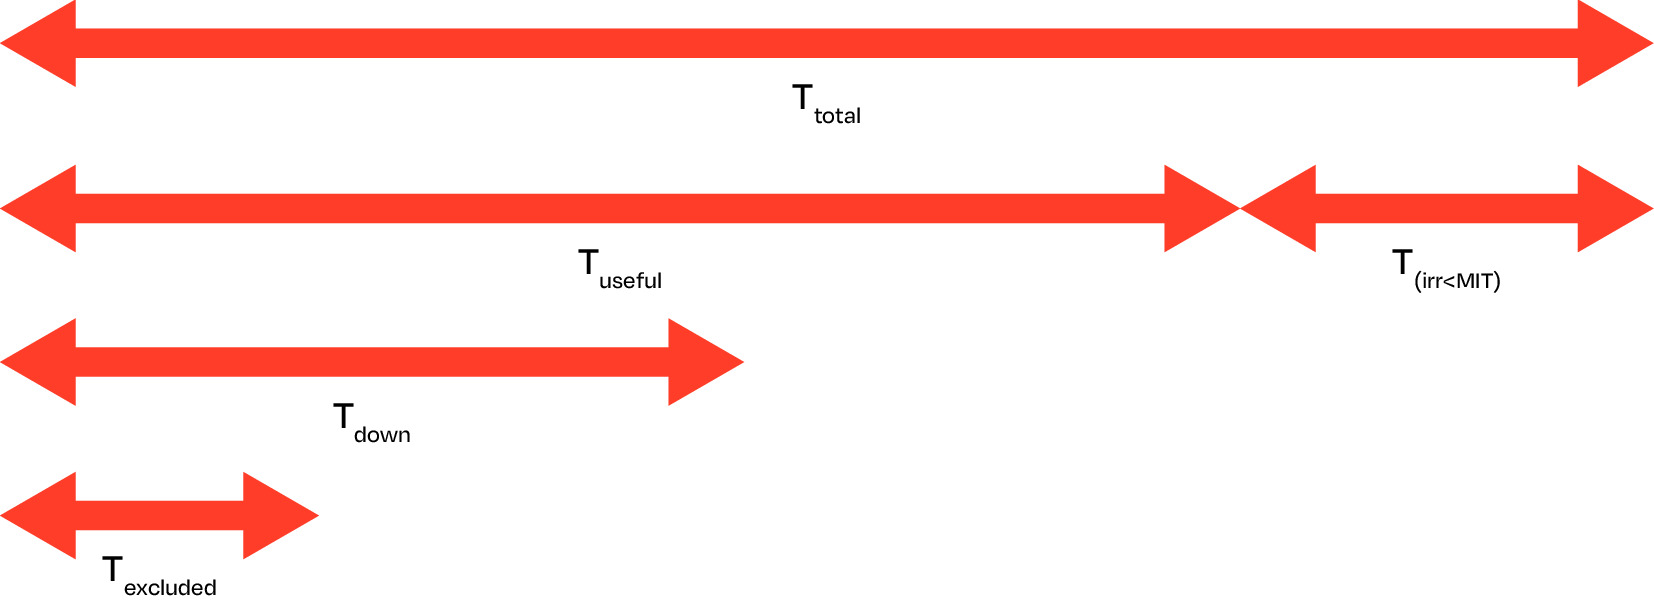
Like Technical Availability, Contractual Availability is also calculated for irradiance levels above the MIT and measured at inverter level. Individual inverters’ Contractual Availabilities ACk should be weighted according to their respective installed DC power Pk. In this case the Contractual Availability of the total solar PV power plant AcAc total with an installed total DC power of P0 can be defined as follows:
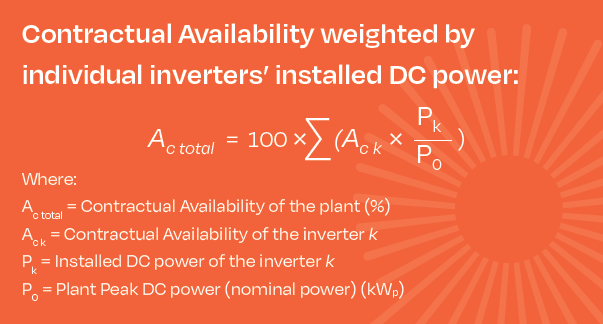
For the calculation of Contractual Availability, typically up to 15 minutes of irradiation and power production data should be taken as a basis if granularity of components remains at the level of inverter or higher. Anything below the level of inverter is then captured with the PR calculation presented earlier.
As Contractual Availability is used for contractual purposes, any failure time should only begin to run when the O&M service provider receives the error message. If the data connection to the site was not available due to an external issue that is beyond the O&M service provider’s responsibility, failure time should only begin after reestablishment of the link. However, if the data connection was lost due to the unavailability of the monitoring system, the failure time should count. In general, the O&M service provider should immediately look at the root cause of the communication loss and resolve it.
The Asset Owner and the O&M service provider should agree on certain failure situations that are not included (exclusion factors) in the calculation of Contractual Availability. Evidence should be provided by the O&M service provider for any exclusion factor and the reason for excluding the event must not be due to an O&M service provider fault. Some good examples for exclusion factors are:
· Force majeure
· Snow and ice on the solar PV modules
· Damage to the solar PV power plant (including the cables up to the feed-in point) by the customer or third parties who are not sub-contractors of O&M service provider, including, but not limited to, vandalism
· Disconnection or reduction of energy generation by the customer or as a result of an order issued to the customer by a court or public authority
· Operational disruption by grid disconnections or disruptions caused by the grid operator
· Disconnections or power regulation by the grid operator or their control devices
· Downtimes resulting from failures of the inverter or MV voltage components (for example, transformer, switchgear), if this requires
o Technical support of the manufacturer and/or
o Logistical support (for example supply of spare parts) by the manufacturer
· Outages of the communication system due to an external issue that is beyond the O&M service provider’s responsibility. Any failure time only begins to run when the O&M service provider receives the error message. If the data connection to the site was not available, failure time shall only begin after reestablishment of the link
· Delays of approval by the customer to conduct necessary works
· Downtimes for implementation of measures to improve the solar PV power plant, if this is agreed between the parties
· Downtimes caused by the fact that the customer has commissioned third parties with the implementation of technical work on the solar PV power plant
· Downtimes caused by Serial Defects on Plant components
· Depending on the O&M contract, time spent waiting for some spare parts to arrive can be excluded from the calculation of Contractual Availability. However, this is not considered a best practice.
Contractual Tracker Availability
Like Contractual Availability, Contractual Tracker Availability also makes allowance for pre-defined exclusions, like maintenance, panel cleaning, etc. A similar formula is used to the technical availability with provision made for any predefined contractual exclusions (see above). The formula can be seen below.
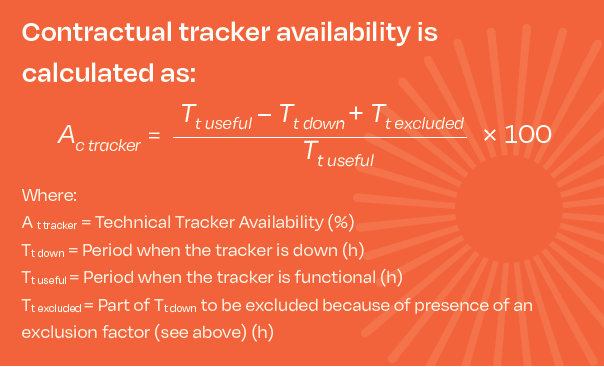
Energy-based Availability
Energy-based Availability takes into consideration that an hour in a period of high irradiance is more valuable than in a period of low irradiance. Therefore, its calculation uses energy (and lost energy), instead of time, for its basis:
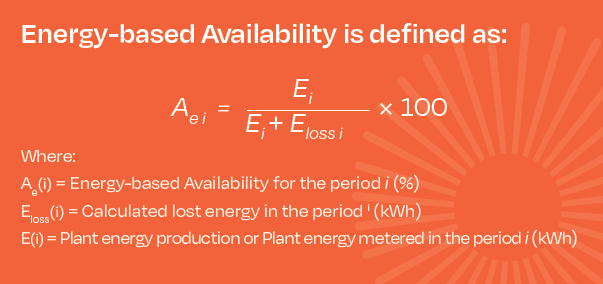
Generally, the Energy Based Availability is used within the O&M Contract in the Availability guarantee chapter and the exclusion factors defined for Contractual Availability tend to apply for Energy-based Availability too.
The following table provides an overview of different types of KPIs and their main purposes.

*Qualitative data is concerned with descriptions, i.e. information that can be observed but not computed (e.g. service experience). In contrast, quantitative is measured on a numerical scale (e.g. Performance Ratio).
[1] Although irradiance and irradiation are often used as synonyms, they do not express the same physical quantities and should not be used interchangeably (see IEC 61724-1:2017):
• Irradiance is the power of the sunlight at a specific moment per unit of area, usually expressed in Watt per square meter (W/m2).
• Irradiation is the power of the sunlight integrated over a period of time (e.g., an hour, a day or a year). In other words, irradiation is the energy per unit of area, calculated as the sum of irradiances over a period of time. It is commonly expressed in kilowatt-hour per square meter (kWh/m2).
[2] The temperature-corrected PR calculation is not consistently applied. Therefore, this note clarifies in brief the best practice for calculating PR using the formulas provided above. There are 2 methods to apply the formula:
• In the time-weighted method, PR is weighted over a period by the time interval. An example would be if the SCADA system provides data in 1 min / 5min / 10 min average values. PR is then calculated for that 1 min / 5min / 10 min period and the resulting PR values are then averaged. This method will generally yield higher PR values in the morning, while production is low and lower PR values mid-day, but with high energy production. Therefore, low PR value are given the same with as the high PR values and the use of an average value of the PR does not take into account the different weight that PR may have over the day. This can artificially increase the PR by up to a couple of percentage points.
• In the irradiance-weighted method, irradiance as a sum counts higher irradiance values as more impactful on the total PR for any given period. This eliminates the weighting effect and provides a more accurate PR. Therefore, all relevant measured parameters should be summed above and below the line over the calculation period before any division and calculation of PR is performed.
[3] The Tdown represents the whole downtime, before the exclusions are applied. Therefore, Texcluded is a part of Tdown in the diagram. In practice you often first see that a plant is down (= measurement of Tdown) and only in the course of troubleshooting one gets the information whether you can exclude part of the downtime.
2.2. Operation under ownership
2.2.1. Operation and maintenance
Operating and maintaining the electrical systems in a PV plant
A. Plant performance monitoring and supervision
The Operations team of the O&M service provider is responsible for continuously monitoring and supervising of the solar PV power plant conditions and its performance. This service is done remotely using monitoring software systems and/or plant operations centres. The O&M service provider should have full access to all data collected from the site to perform data analysis and provide direction to the Maintenance service provider/team.
Normally, in Fault Management (Incident Management) several roles and support levels interact:
· With the help of monitoring and its alarms the Operations Center (Control Room) detects a fault. It is responsible for opening a “ticket” and coordinating troubleshooting actions. It collects as much information and diagnostics as possible to establish initial documentation, tries to categorise the issue and, where possible, to resolve it instantly. This is known as 1st Level Support. Then it tracks the incidents until their resolution
· If the fault cannot be sufficiently categorised, the Operations Center may call out a field technician who can be a local electrician or member of the maintenance team. This person will analyse and try to resolve the fault on-site (1st Level Support). Their knowledge and access rights may be not sufficient in some situations, but they can fix most faults to an adequate level. They may also contact the vendor’s hotline to help them with the diagnosis
· If 1st Level Support is not able to resolve the incident right away, it will escalate it to 2nd Level Support. This consists of solar PV engineers or Project/Account Managers who have greater technical skills, higher access permissions, and enough time to analyse the fault in depth. They may be internal or of the vendor’s staff
· If an incident requires special expertise or access, 2nd Level engineers might need to contact experts (in-house or from the vendor or a third party). This is known as 3rd level support. In some organisations the Project/Account Managers can cover both 2nd and 3rd Level Support, based on their seniority and experience
· When the fault is solved, the Operations Center closes the ticket

Besides the data from the site, if a CCTV system is available on-site, the O&M service provider should, as a best practice, be able to access it for visual supervision and also have access to local weather information.
The O&M service provider is responsible for being the main interface between the plant Owner, the grid operator, and the regulator (if applicable) over the lifetime of the O&M contract regarding production data. The Asset Owner should be able to contact the Operations team via a hotline during daytime, when the system is expected to generate electricity. The Operations team is also responsible for coordinating accordingly with the Maintenance service provider/team.
Performance analysis and improvement
The O&M service provider ensures that the performance monitoring is done correctly.
In general, the data should be analysed at the following levels:
1. Portfolio level (group of plants) under control of the O&M service provider (minimum requirement)
2. Plant level (minimum requirement)
3. Inverter level (minimum requirement)
4. String level (as a recommendation)
The analysis should show the required data on the levels listed above and for different time aggregation periods from the actual recording interval up to monthly and quarterly levels.
The analysis should also include the option for having custom alarms based on client specific thresholds such as business plan data or real-time deviations between inverters on-site.
In particular, the agreed KPIs should be calculated and reported. Special attention should be paid to the fact that KPI calculations should take into consideration the contractual parameters between O&M service provider and Asset Owner, to provide an accurate and useful calculation for evaluation and eventually liquidated damages or bonuses.
B. Power plant controls
If applicable, the Operations team can be the point of contact for the grid operator for plant controls. The Operations team will control the plant remotely (if possible) or instruct the qualified maintenance personnel to operate breakers/controls on site. The O&M service provider is responsible for the remote plant controls or emergency shutdown of the plant (if possible) and in accordance with the respective grid operator requirements, regulations and the aggregator’s requirements. The plant control function varies from country to country and in some cases from region to region. The respective solar PV power plant control document for the area details regulations issued by the grid operator and (energy market) regulator.
The Power Plant Controller itself is a control system that can manage several parameters such as active and reactive power and ramp control of solar PV power plants. The set points can normally be commanded either remotely or locally from the Supervisory Control And Data Acquisition system (SCADA). Moreover, the system should be password protected and log all the executed commands. Any executed commands should release real-time notifications to the Operations team.
The following list shows typically controlled parameters in a solar PV power plant:
· Absolute Active Power Control
· Power Factor Control
· Ramp Control (Active and Reactive Power if needed)
· Frequency Control
· Reactive Power Control
· Voltage Control
C. Power Plant Maintenance
Maintenance is usually carried out on-site by specialised technicians or subcontractors, in close coordination with the Operations team’s analyses. In modern solar PV power plants, automation of maintenance tasks is becoming more prevalent. However, this practice is still developing and is not widespread currently. The following figure provides an overview of the four main types of power plant maintenance.
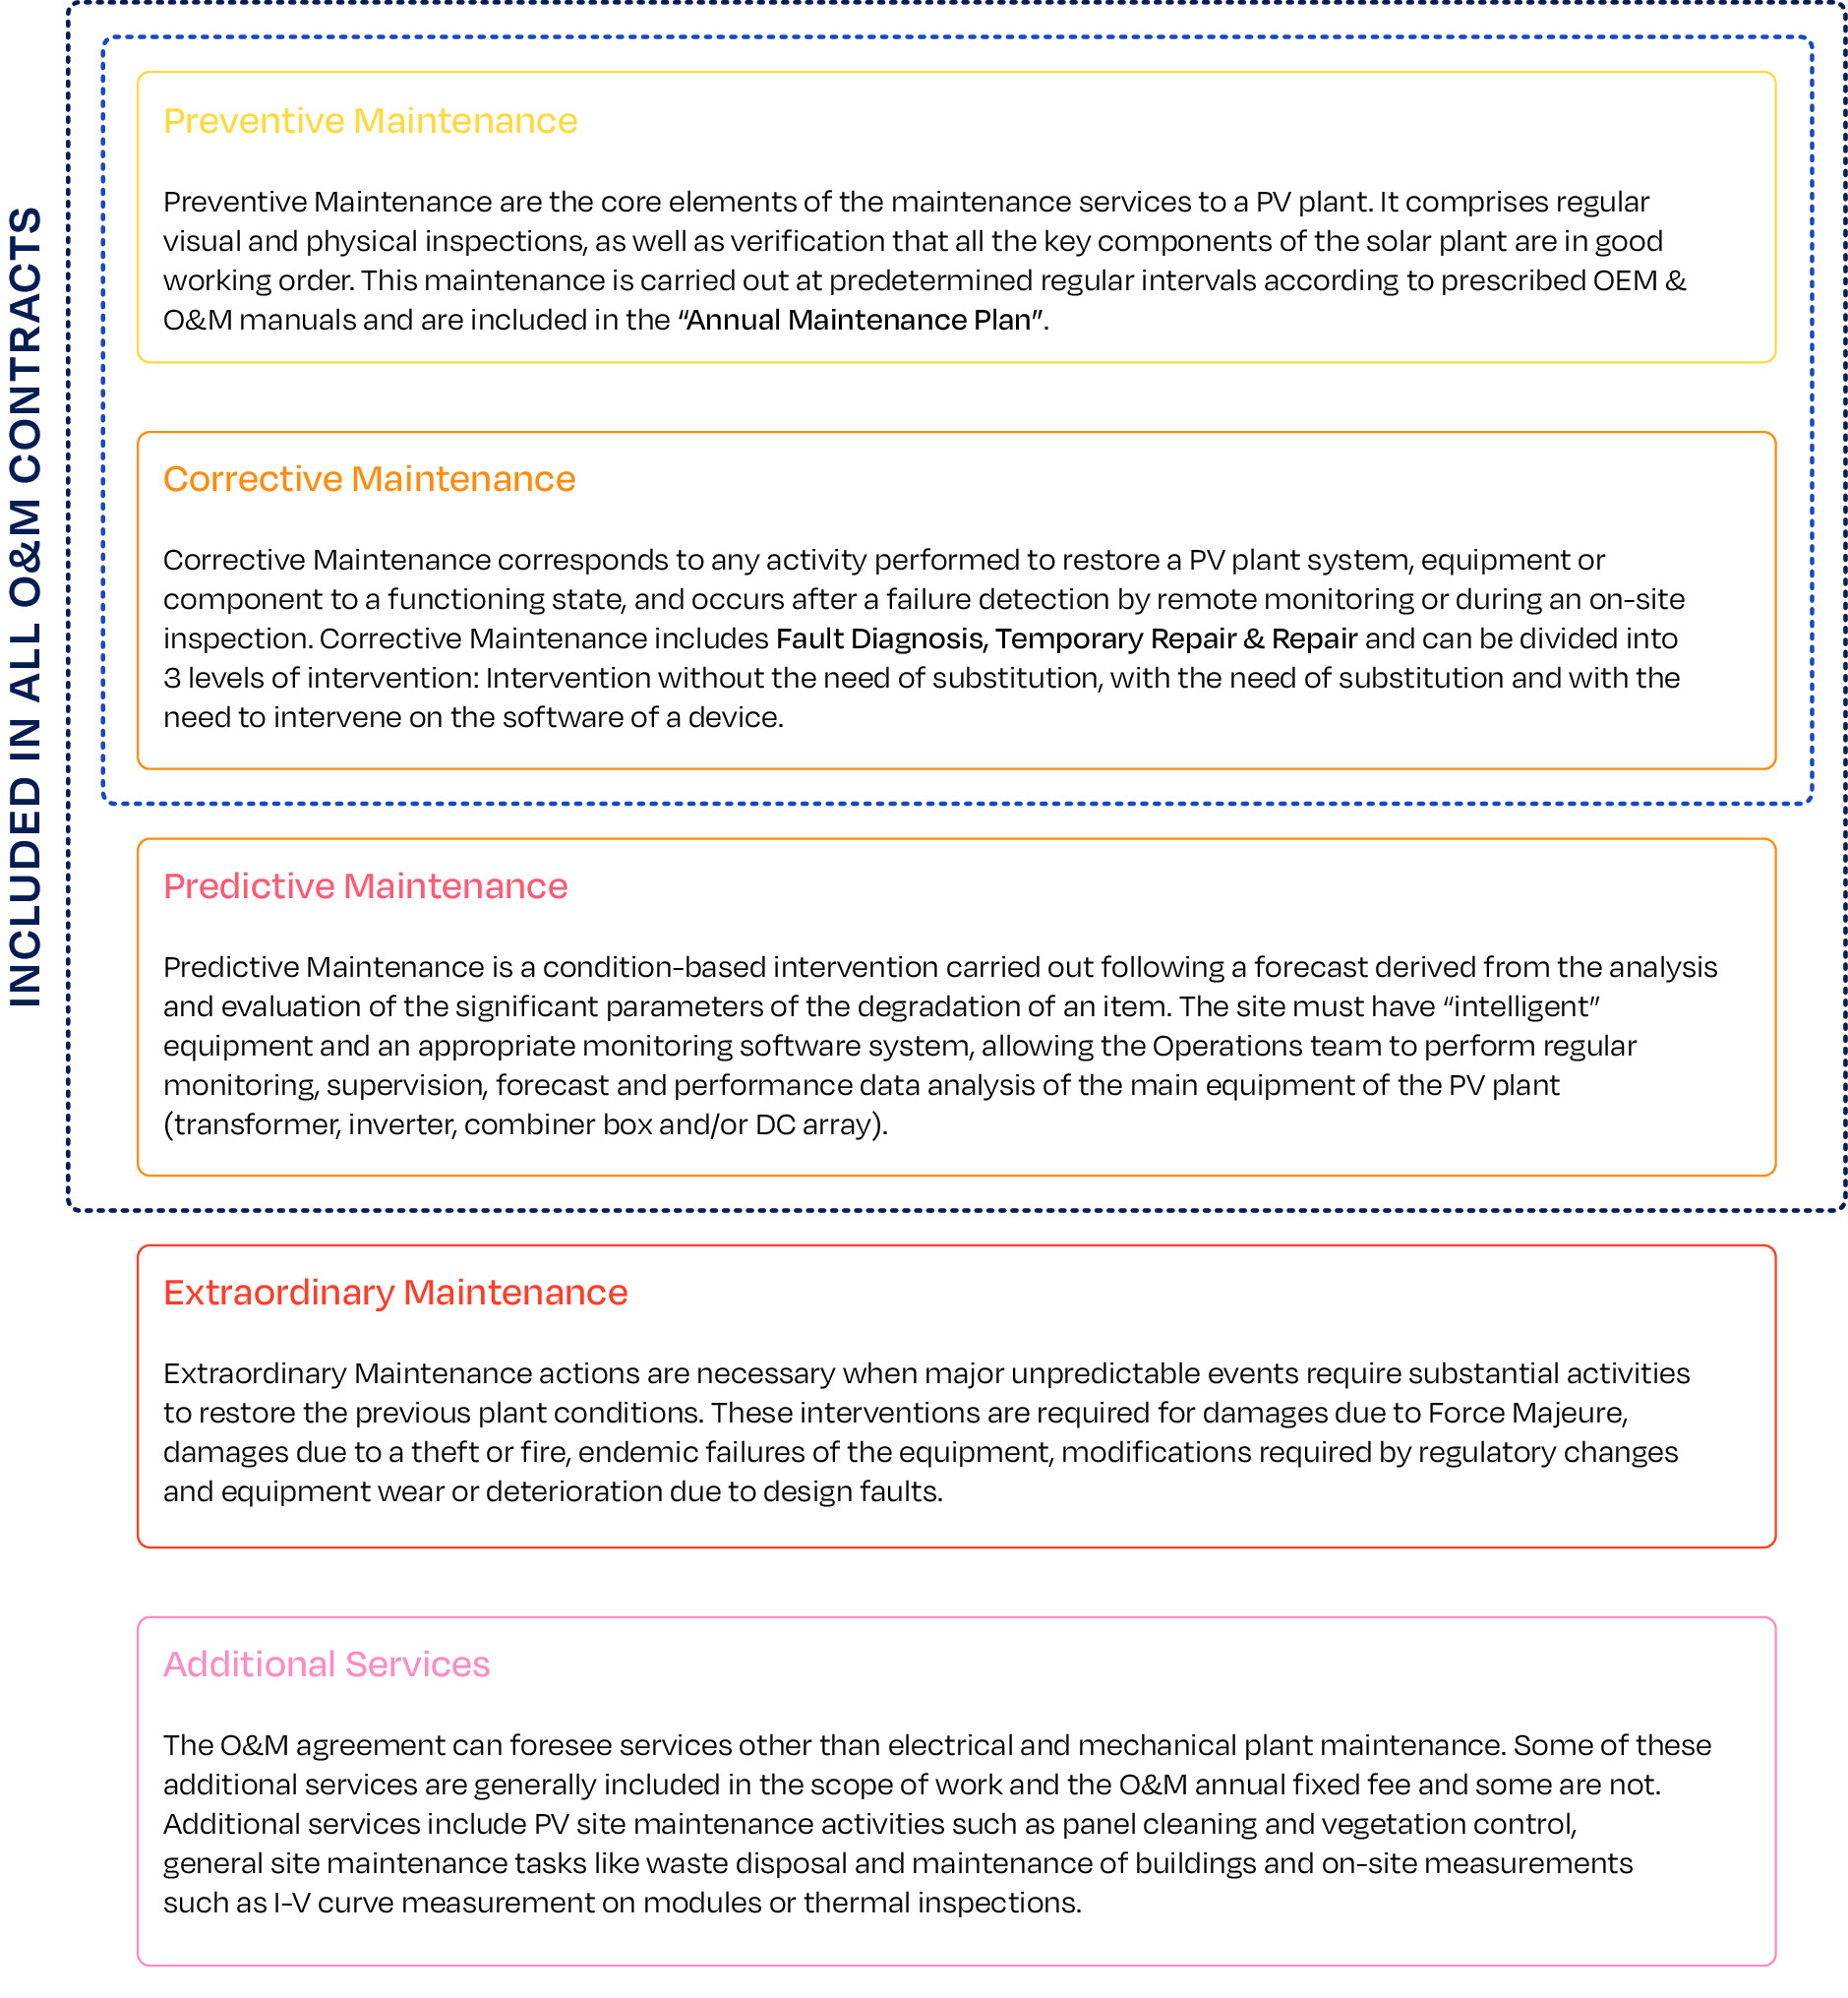
Preventive Maintenance
Preventive Maintenance activities are the core element of the maintenance services to a solar PV power plant. It comprises regular visual and physical inspections, as well as verification activities.
The maintenance of all key components is carried out at predetermined intervals or at least according to prescribed OEM and O&M manuals. These are included in a detailed Annual Maintenance Plan which provides an established time schedule with a specific number of iterations for carrying out the maintenance.
It must also maintain the equipment and component warranties in place and reduce the probability of failure or degradation. The activities must also be consistent with respective legal issues such as national standards for periodic inspection of certain electrical components. It should be noted that the various maintenance activities that an O&M service provider is expected to carry out require personnel qualified to carry them out. The O&M service provider must ensure that they have the appropriate range of skills available to fulfil their contractual obligations (for more information on maintenance activities and the skills they require, see Annex B of the O&M Guidelines and Annex A of the Lifecycle Quality Guidelines). The O&M contract should include this scope of services and each task frequency.
It is the responsibility of the O&M service provider to prepare the task plan, according to the time intervals in the contract.
The “Annual Maintenance Plan” (see Annex E or download it from www.solarpowereurope.org) developed as an attachment of this report includes a list of regular inspections per equipment (e.g., module, inverter etc) and per unit of equipment (e.g., sensors, fuses etc).
An example of Preventive Maintenance is thermographic inspection which aims to identify defective panels on a solar PV power plant. Indeed, several categories of anomalies (hot spots, hot strips, moisture ingress, soling, etc.) can occur, significantly reducing the whole plant productivity. Relevant inspection procedures are performed either by operators with handheld cameras or using remotely piloted drones or piloted aircraft equipped with dedicated thermal and optical payloads.
Preventive Maintenance also includes ad-hoc replacement of parts of inverters or sensors. In general, it is important to follow detailed Preventive Maintenance procedures, which are agreed upon in the Annual Maintenance Plan.
In cases where downtime is necessary to perform Preventive Maintenance, its execution during the night would be considered best practice as the overall power generation is not affected.
Corrective Maintenance
Corrective Maintenance covers the activities performed by the Maintenance team to restore a solar PV power plant system, equipment or component to a status where it can perform the required function. Corrective Maintenance takes place after a failure detection either by remote monitoring and supervision or during regular inspections and specific measurement activities (see Annex E).
Corrective Maintenance includes three activities:
1. Fault Diagnosis also called troubleshooting to identify and locate the cause of the fault
2. Temporary Repair, to restore the required function of a faulty item for a limited time, until a full repair is carried out
3. Full repair, to restore the required function permanently
In cases where the solar PV power plant or segments thereof need to be taken offline, Corrective Maintenance should be performed at night or during periods of low irradiation as the overall power generation is not affected.
A key aspect of corrective maintenance is to be able to track failures to their root cause. This is most often a problematic manufacturer/model/serial number but may also be linked to installation errors or environmental conditions such as temperature inside enclosures. Corrective Maintenance processes should also track the efficacy of responses to problems (what fixes the problem reliably?).
Corrective Maintenance can be divided into three levels of intervention to restore the functionality of a device, that could be included in the O&M agreement or billed separately on hourly rates:
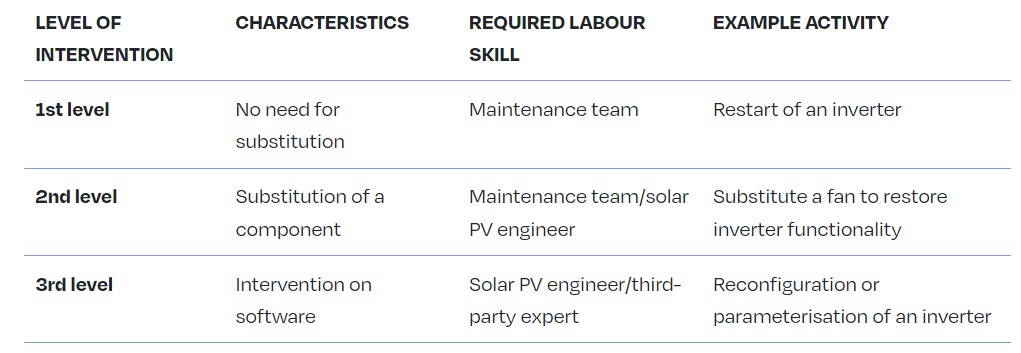
3rd level activities could be included in the O&M agreement or billed separately to it, depending on the specific scope of work agreed between the parties. Generally, however, this intervention is excluded by the contractual scope of work, especially when the device manufacturers’ maintenance team or third-party licensed company needs to intervene.
Interventions for reconditioning, renewal, and technical updating, save for the cases where those actions are directly included in the scope of the contract, should be excluded from Corrective Maintenance, and included in the Extraordinary Maintenance.
The scope of Corrective Maintenance activities and its “border” or definition with respect to Preventive Maintenance requires specific attention and it should be properly defined in the Maintenance contract. For an easier comprehension, an example is presented below:
· A cable termination tightening activity using a torque device for correct fixation should be under the Preventive Maintenance scope of works, but depending on the quantity and/or frequency, it could be considered a Corrective Maintenance activity. The Annual Maintenance plan therefore states the extent of each planned activity.
Usually, Corrective Maintenance work must be accomplished within the contractually agreed minimum Response Times.
Contractual agreements can foresee that the included Corrective Maintenance will be capped on a per year basis. Depending on whether the Asset Owner is a purely financial investor or an energy producer (e.g. utility or IPP) the requirements for coverage under the Corrective Maintenance will vary.
Predictive Maintenance
Predictive Maintenance is a special service provided by O&M service providers who follow best practices principles. It is defined as a condition-based maintenance carried out following a forecast derived from the analysis and evaluation of the significant parameters of the degradation of the item (according to EN 13306). A prerequisite for a good Predictive Maintenance is that the devices on-site can provide information about their state, in such a way that the O&M service providers can evaluate trends or events that signal deterioration in a device. As a best practice, the device manufacturer should provide a complete list of status and error codes produced by the device, together with the detailed description of their meaning and their impact on the functioning of the device. Additionally, a standardisation of status and error codes through inverters and dataloggers from the same brand should be followed and, in the future, this standardisation should be common to all manufacturers.
Stakeholders who want to benefit from Predictive Maintenance should, as a best practice, select “intelligent” equipment set with sufficient sensors, and opt for a monitoring software system that provides basic trending and comparison (timewise or between components and even between solar PV sites) functionalities (minimum requirement).
The Operations team of the O&M service provider enables Predictive Maintenance thorough continuous or regular monitoring, supervision, forecast and performance data analysis (e.g., historical performance and anomalies) of the solar PV power plant (at the DC array, transformer, inverter, combiner box or/and string level). This can identify subtle trends that would otherwise go unnoticed until the next round of circuit testing or thermal imaging inspection and that indicate upcoming component or system failures or underperformance (e.g., at solar PV modules, inverters, combiner boxes, trackers, etc. level).
Before deciding which Predictive Maintenance actions to recommend, the Operations team should implement and develop procedures to effectively analyse historical data and faster identify behaviour changes that might jeopardise systems performance. These changes of behaviour are usually related to the pre-determined or unpredicted equipment degradation process. For this reason, it is important to define and to monitor all significant parameters of wear-out status, based on the sensors installed, algorithms implemented into the supervision system and other techniques.
Following such analysis, the Maintenance team can implement Predictive Maintenance activities to prevent any possible failures which can cause safety issues and energy generation loss.
For efficient Predictive Maintenance, a certain level of maturity and experience is required, which is at best a combination of knowledge of the respective system’s performance, related equipment design, operation behaviour, and relevant the service provider’s track record. Normally it is a process that starts after the implementation of an appropriate monitoring system and the recreation of a baseline. This baseline will then represent the entire solar PV system operation, how different pieces of equipment interact with each other, and how the system reacts to “environmental” changes.
Predictive Maintenance has several advantages, including:
- Optimising the safety management of equipment and systems during their entire lifetime
- Helping to anticipate maintenance activities (both corrective and preventive)
- Delaying, eliminating and optimising some maintenance activities
- Reducing time for repairs and optimising maintenance and Spare Parts Management costs
- Reducing spare parts replacement costs
- Increasing availability, energy production and performance of equipment and systems
- Reducing emergency and non-planned work
- Improving predictability
The following two specific examples show how Predictive Maintenance might be implemented.
Example 1 – An O&M service provider signs a new contract for a solar PV power plant equipped with central inverters. Analysing its backlog of maintenance, the O&M service provider knows that these inverters showed signs of power loss due to overheating at several points in the past. This might be related to problems in the air flow, filter obstructions, fans, or environmental changes (high temperature during summer). A decision was taken to monitor the temperature of IGBTs (Insulated-Gate Bipolar Transistors). An “air flow inspection” was performed, prior to any emergency action being required, to determine whether power loss was related to air flow. This type of activity is a condition-based inspection performed after the detection of a change in a significant parameter. It is also considered as a type of Predictive Maintenance. The final purpose is to identify if, for example, the ventilation systems will need some upgrade, replacement, or if there is any type of air flow obstruction or even if a filter replacement or cleaning is required.
Example 2 – Predictive Maintenance for optimised hardware replacement cycle relying on big data analytics or artificial intelligence. For more information on this innovation.
Extraordinary Maintenance
Extraordinary Maintenance actions are necessary when major unpredictable events take place in the plant that require substantial activities and works to restore the previous plant conditions (or any maintenance activity generally not covered or excluded from the O&M Contract).
“Force Majeure” events affecting solar PV power plants include high winds, flooding, hurricanes, tornados, hail, lightning, and any number of other severe weather events. Extraordinary Maintenance associated with severe weather include safety shutdown, inspection to document damage, electrical testing (integrity of circuits and grounding), remove/repair/replace decisions, and recommissioning confirming proper operation and documenting changes made during repairs.
Generally, these activities are billed separately in the O&M contract and are managed under a separate order. It is advisable that the O&M contract includes the rules agreed among the parties to prepare the quotation and to execute the works. Both a “lump sum turn-key” or a “cost-plus” method can be used for such purposes.
Extraordinary Maintenance interventions are required for:
· Damages that are a consequence of a Force Majeure event
· Damages resulting from theft or fire
· Serial defects or endemic failures on equipment, occurring suddenly and after months or years from plant start-up
· Modifications required by regulatory changes
In cases where the O&M service provider and the EPC service provider are different entities, the following occurrence should also be considered as Extraordinary Maintenance:
· Major issues that the O&M service provider becomes aware of during its ordinary activity. These could be defects or other problems that are not a consequence of equipment wear or deterioration and can be reasonably considered to have been caused by design mistakes (e.g., “hidden” defects that require re-engineering)
Although not necessarily maintenance interventions, revamping and repowering can also be included in the Extraordinary Maintenance list in the O&M agreement, or at least managed with the same rules.
After the approval by the Asset Owner of the O&M service provider’s proposal, activities may commence, subject to availability of the required equipment and special machinery (if required).
The potential loss of energy between the event occurrence and full repair is very difficult to determine in the SPV financial model. However, many of the above events can be reimbursed to the Asset Owner by the insurance company under any “All Risk Insurance” coverage that is in place. Relevant conditions and requirements according to the insurance policies of the Asset Owner need to be shared with the O&M service provider.
Best Practices of O&M agreements regarding Extraordinary Maintenance activities include:
· General rules to quantify price and to elaborate a schedule to perform repair activities, and the right of the Asset Owner to ask for third party quotations to compare to the quotation of the O&M service provider. In this case a “right-to-match” option should be granted to the O&M service provider
· The obligation for the Asset Owner to have in place a consistent “All Risk Property” Insurance including loss of profit
Additional services
The O&M agreement can foresee services other than those pertaining to electrical and mechanical plant maintenance as per the above sections. Some of these additional services are generally included in the scope of work and the O&M annual fixed fee and some are not.
Additional services not included in the O&M contract scope of work can be requested on demand and can either be priced per service action or based on hourly rates applicable to the level of qualification of staff required to perform the works. These hourly rates usually escalate at the same rate as the O&M Service fee. In some cases, a binding price list for the delivery of some of these additional services can be included in the O&M contract as well.
Module Cleaning
Regular module cleaning is an important part of solar maintenance and the problems associated with soiled modules are often underestimated. Prolonged periods of time between cleans can result in bird droppings etching modules and lichen growth, both of which can be extremely difficult to remove. The intensity and type of soiling depend heavily on the location of the solar PV system (e.g., its proximity to industrial areas, agricultural land, or railway lines).
Module cleaning methods therefore vary from manual, to robotic and mechanical and each have their own advantages and disadvantages. The frequency of cleaning should be decided on a site-by-site basis, and it may be that certain parts of a site will need cleaning more often than other parts of the same site.
When choosing a module cleaning company, Asset Owners and O&M service providers should check the following:
· The suggested method of cleaning is fully in-line with the module manufacturer’s warranty and according to specifications from IEC 61215 (e.g., maximum pressure load)
· The modules should be cleaned with high quality, ultra-pure water, not tap, mains or borehole water. Detergents must be biodegradable and comply with local environmental regulations
· H&S considerations should be made with regard to keeping staff safe on site. This should include some form of H&S accreditation and specific training for solar module cleaning, including working at height, if cleaning roof mounted modules
Table 10 presents a non-exhaustive list of Additional services.
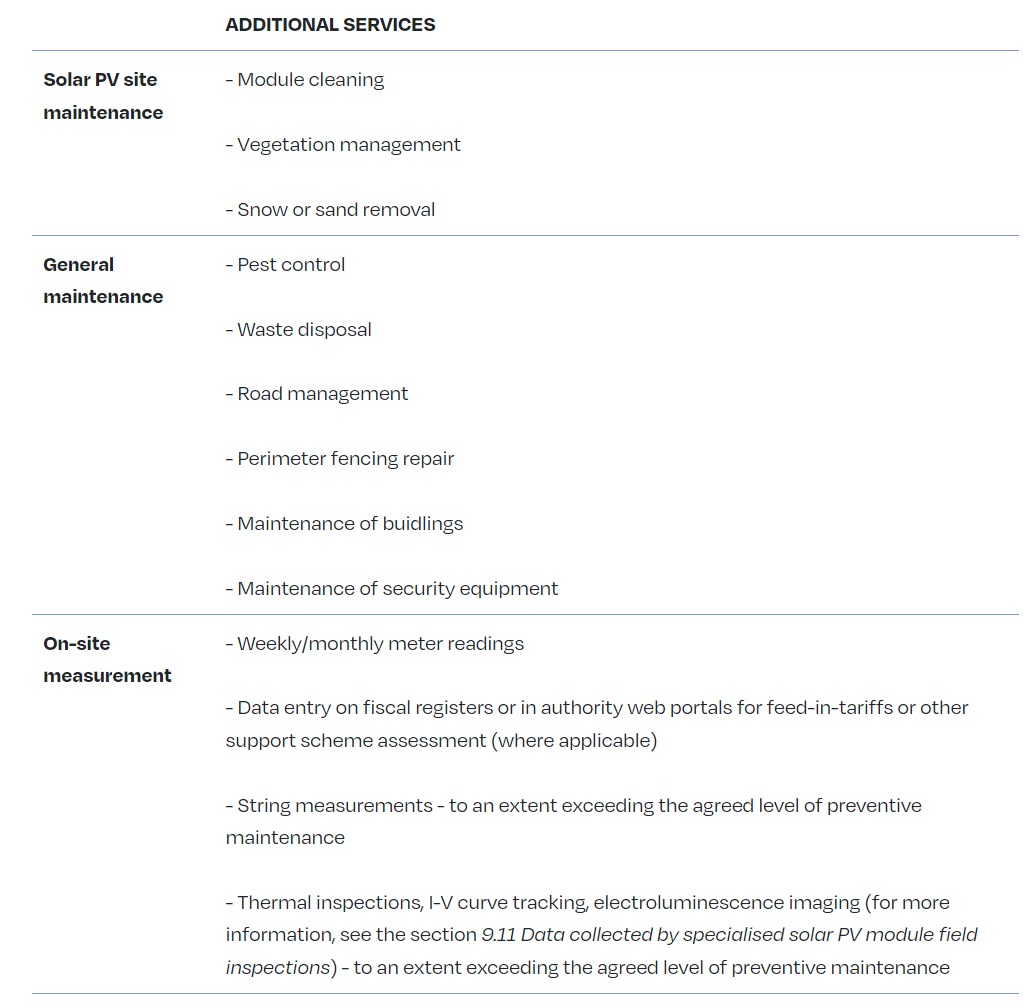
Some of these items can be considered as a part of Preventive Maintenance. This depends on the agreement between the Asset Owner and the O&M service provider.
From a technological point of view, the usage of aerial inspections is beneficial to efficiently (time and costs) obtain a context awareness needed to perform better planning of site maintenance activities as well as execution of on-site measurements (specifically thermographic inspections).
Advanced aerial thermography
While thermographic inspections have become well established as a tool in preventive and corrective maintenance scheduling, the amount of effort and manual labour required for data gathering in the field has posed financial and operational challenges for their widespread use.
Using thermographic cameras mounted on drones (Remotely Piloted Aircrafts, RPAs or Unmanned Aerial Vehicles, UAVs) or purpose-modified piloted aircraft, instead of handheld devices, the operator flies over the solar PV modules to capture thermographic images or videos. This data is then analysed to create inspection reports which can be used to form the basis of Preventive and Corrective Maintenance tasks. If deployed properly, aerial thermography can provide several operational and financial advantages. It also reduces H&S risks involved in manual inspections, such as prolonged field exposure in dangerous working environments, and the hazards involved in moving around the site, particularly on rooftop installations. Aerial inspections can also pinpoint anomalies to precise locations, thus focusing and reducing the time required for repair work.
Please refer to the Aerial Thermography Checklist of the Solar Best Practices Mark for a synthesis of the most important best practices and recommendation with respect to aerial thermography.[2]
Data acquisition
In this stage a flyover is performed where raw infrared (IR) thermographic images and visual photos or videos are recorded. Depending on the solution, additional geolocation services and 3D modelling of the entire plant may be offered. Some other solutions provide additional sensors to record weather variables (usually irradiance and ambient temperature) during the flyover. The drone is typically pre-programmed with a flight path designed to cover the entirety of the solar PV asset being inspected. The pre-programmed flight path allows for precise and repeatable flights to be performed, increases the accuracy of results, and ensures that the same parameters are used during each subsequent aerial inspection.
With the advent of aerial inspections, resources required for data collection can be significantly reduced. For instance, a 12MWp solar PV power plant can be inspected in a single day. Aerial IR thermography must always be conducted following a set of minimum technical requirements (described in IEC TS 62446-3:2017). Otherwise, it is of little value for effective plant maintenance. In that context, high-quality IR images captured by an aerial platform and their proper post-processing allow for a detailed solar PV module failure analysis that could trigger conclusive maintenance decisions. Furthermore, field interventions can be optimised, and solar PV power plant underperformance can be better understood and addressed (e.g., faulty modules that need to be replaced can be identified with precision and high-quality IR images can be used as proof in warranty claims or in correlation with solar PV monitoring data). Additionally, since images are taken from the air, the data yields a helpful overview for checking whether plant layout, its electrical/physical configuration and other documents are correct.
As with any form of thermography, the inspection method and its diagnostic efficiency are significantly limited by and dependent on meteorological conditions. For the inspection data to be of value, a minimum radiation of 600 W/m2 is required. For drone inspections, to control the RPA safely wind speeds should not exceed 28 km/h (this is dependent on the type of RPA used).
Post-processing
The post-processing activities consist of all the data processing and analysis techniques used to produce the final report and all the related deliverables. These activities can be done manually or automatically with specialised software.
The activities comprised in this stage are described as a series of subtasks in the following table.

There are many companies offering high-quality industrial aerial flights in the market. These are typically referred to as Drone Service Providers (DSPs). While there are companies using drones in a variety of situations (IR inspections of solar PV power plants, wind turbines, oil ducts, offshore oil extraction platforms, and infrastructure etc.), DSPs are emerging that focus solely on the solar solar PV segment. Therefore, this data acquisition stage is an activity that could be easily outsourced by O&M service providers, mitigating the risks related to technology obsolescence and avoiding the costs and complexities of regular drone maintenance. This is particularly beneficial given the rapid rate of development and innovation in the drone technology space. Selecting a DSP with specialisation in solar solar PV inspections gives O&M service providers the additional advantage of relevant expertise and experience, which can equip them with superior insights from the data captured.
There are some companies which utilise specially modified piloted aircraft, flying at a higher altitude, in lieu of drones for inspections of large sites and portfolios. These aircraft are able to cover ground quicker than drones (up to 150MW/hr) while maintaining high resolution due to the higher quality of cameras which can be used. However, these systems are prohibitively expensive for individual sites due to the large mobilisation costs.
Most companies today still rely on manual data processing, which represents a major drawback for large portfolios as human-error (and user-dependence) drives down the accuracy and “consistency” of thermal imaging assessments. This means that companies with automated solutions have a huge advantage in this regard. The advent of AI and machine learning algorithms built into automated data processing solutions also provides customers with significantly greater processing speed and inspection accuracy, and analyses that improve over time.
Aerial inspections and their associated post-processing activities are evolving very rapidly, and the adoption of such new technologies is of significant strategic importance in today’s highly competitive O&M market. As the playing field moves towards a post-subsidy era, such additional services as advanced aerial thermography that can save O&M service providers time and money, seeing them become a standard practice out of necessity.
Pilots
Any aerial thermography or other solar PV module and plant monitoring application involving drones or piloted aircrafts must be carried out by a licensed and insured operator and in accordance with all local and EU-level civil aviation regulations. Before any such operations can take place, each flight must be thoroughly planned from a logistics, regulatory and safety perspective, and a comprehensive on-site risk assessment conducted, with findings recorded in a flight log. In addition to the collected inspection data, each flight should also be fully recorded in terms of date, time, wind speed and direction and battery levels.
Vegetation Management
Vegetation management can represent a significant portion of the operations costs of a solar PV system. Some key items to consider in vegetation management:
- Damage Reduction: Vegetation management can reduce direct mechanical damage caused by vegetation - especially woody vegetation - growing into modules and structures. Damage can also be caused by direct shading causing hot-spot formation on modules, potentially leading to long-term module damage
- Performance Enhancement: Vegetation can cause module shading, which leads to degraded module performance. This effect is disproportionate to the amount of shading, so a small amount of shading can cause a significant amount of power loss
- Erosion Control: Vegetation is critical for soil stabilisation and avoidance of erosion damage on sites. Uncontrolled erosion can cause significant structural damage on a project over time
- Carbon Sequestration: Continuous vegetation management can assist in increasing soil carbon sequestration, especially with the use of grazing animals, who are able to fertilize the soil while enhancing soil carbon capture
- Biodiversity Enhancement: The use of natural pollinators and native vegetation can enhance local biodiversity. This can improve community engagement, lead to reduced vegetation management costs, and in some cases add revenue streams to a project
- Community engagement and social license to operate: Vegetation management can be one of the most visible maintenance activities for local communities and can affect aesthetics, noise pollution, erosion, runoff, and chemical contamination concerns. Vegetation management done well can enhance relations with the community and local councils and improve the social license to operate. Done poorly, vegetation management can cause conflict with local communities and planning councils and can lead to potential legal concerns
Some options for vegetation management are outlined in the table below:
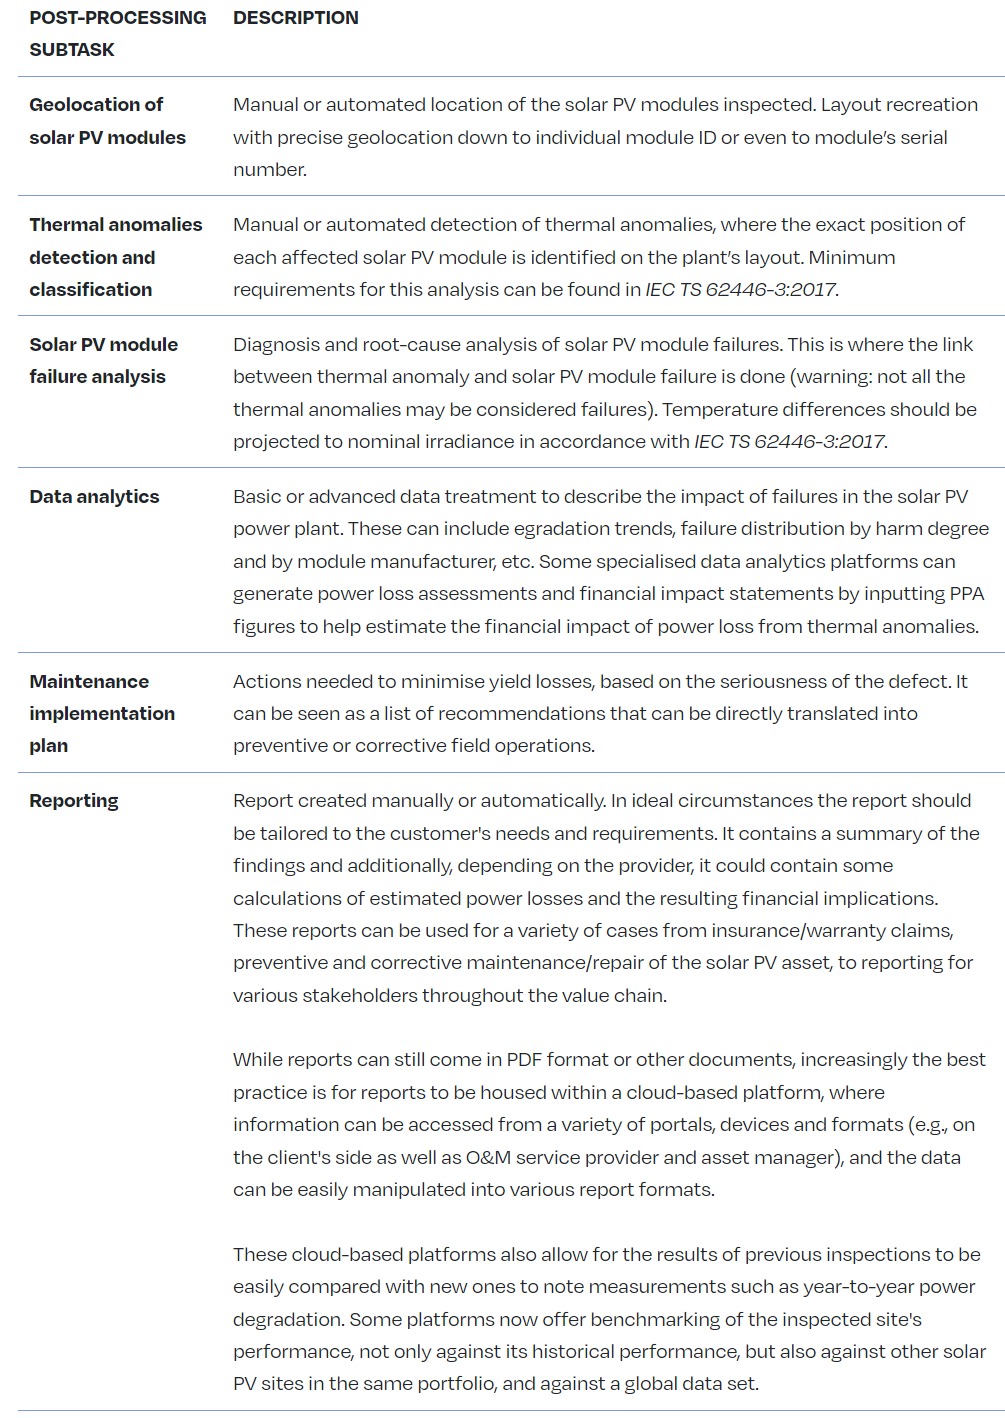
D. Data and Monitoring Requirements
Please see section 1.1.1 "Data and communications".
Operating and maintaining the data and comms infrastructures
A. Documentation Management System (DMS)
Solar PV power plant documentation is crucial for an in-depth understanding of the design, configuration, and technical details of an asset. It is the Asset Owner’s responsibility to provide those documents and, if not available, they should, as best practice, be recreated at the Asset Owner’s cost.
Before assuming any maintenance and/or operational activities, it is important to understand in-depth the technical characteristics of the asset. There are two important aspects related to the management of this information:
· Information type and depth of detail / as-built documentation
· Management and control
Moreover, for quality / risk management and effective operations management a good and clear documentation of contract information, plant information, maintenance activities and asset management are needed over its lifetime. This is what is called here:
· Record control (or records management)
Currently, there are different types of DMS available, along with a series of standards (ISO), that can be implemented. This is an important requirement that would allow any relevant party to trace any changes during the lifetime of the plant’s operation and follow up accordingly (e.g., when the O&M service provider changes, or the teams change, or the plant is sold etc).
Information type and depth of detail / as-built documentation
The documentation set accompanying the solar PV power plant should, as a best practice, contain the documents described in Annex C. The IEC 62446 standard also covers the minimum requirements for as-built documentation.
In general, for optimum service provision and as a best practice, the O&M service provider should have access to all possible documents (from the EPC phase). The Site Operating Plan is the comprehensive document prepared and provided by the plant EPC service provider, which lays out a complete overview of its location, layout, electrical diagrams, components in use and reference to their operating manuals, HSSE rules for the site and certain further topics. All detailed drawings from the EPC service provider need to be handed over to the O&M service provider and being stored safely for immediate access in case of solar PV power plant issues or questions and clarifications with regards to permits and regulation.
When storing documents, thought must be given to accessibility. As a minimum, project documentation should be available in a searchable PDF format to facilitate the identification of key information. Moreover, project drawings, such as the as-built design, should be editable in case they need correcting, or change management processes mean they need to be updated.
Management and control
Regarding the document control, the following guidelines should be followed:
· Documents should be stored either electronically or physically (depending on permits/regulations) in a location with controlled access. Electronic copies should be made of all documents, and these should be searchable and editable
· Only authorised people should be able to view or modify the documentation. A logbook of all the modifications should be kept. As a best practice, logbooks should at a minimum contain the following information:
o Name of person, who modified the document
o Date of modification
o Reason for modification and further information, e.g., link to the work orders and service activities
· Versioning control should be implemented as a best practice. People involved should be able to review past versions and be able to follow through the whole history of the document. The easiest way to ensure this is through using an electronic document management system, which should be considered a best practice
Record control
A key point is that necessary data and documentation are available for all parties in a shared environment and that alarms and maintenance can be documented in a seamless way. Critical to the Operations team is that the maintenance tasks are documented back to and linked with the alarms which might have triggered the respective maintenance activity (work order management system log). Photographs from the site should complement the documentation (when applicable). Tickets (ticket interventions) should be stored electronically and made available to all partners. The Asset Owner should also maintain ownership of these records for future references.
To improve future performance and predictive maintenance, it is crucial to keep a record of past and ongoing O&M data, workflows and alarms. This record should seek to link these elements in a cost-effective way, following an agreed naming convention. This will improve accessibility and allow for easier tracing, facilitating comprehensive lessons learned exercises, and resulting in concrete future recommendations for the client. These analyses should also be recorded.
There should be proper documentation for curtailment periods as well as repair periods when the plant is fully or partly unavailable. This will all be recorded by the monitoring system to measure the energy lost during maintenance activities. For this, having the correct reference values at hand is crucial. For important examples of input records that should be included in the record control, see Annex D of the O&M Best Practice Guidelines.
As in the case of the as-built documentation, all records, data and configuration of the monitoring tool, and any sort of documentation and log that might be useful for proper service provision must be backed up and available when required. This is also important when the O&M service provider changes.
B. Plant performance monitoring and supervision
The Operations team of the O&M service provider is responsible for continuously monitoring and supervising of the solar PV power plant conditions and its performance. This service is done remotely using monitoring software systems and/or plant operations centres. The O&M service provider should have full access to all data collected from the site to perform data analysis and provide direction to the Maintenance service provider/team.
Normally, in Fault Management (Incident Management) several roles and support levels interact:
· With the help of monitoring and its alarms the Operations Center (Control Room) detects a fault. It is responsible for opening a “ticket” and coordinating troubleshooting actions. It collects as much information and diagnostics as possible to establish initial documentation, tries to categorise the issue and, where possible, to resolve it instantly. This is known as 1st Level Support. Then it tracks the incidents until their resolution
· If the fault cannot be sufficiently categorised, the Operations Center may call out a field technician who can be a local electrician or member of the maintenance team. This person will analyse and try to resolve the fault on-site (1st Level Support). Their knowledge and access rights may be not sufficient in some situations, but they can fix most faults to an adequate level. They may also contact the vendor’s hotline to help them with the diagnosis
· If 1st Level Support is not able to resolve the incident right away, it will escalate it to 2nd Level Support. This consists of solar PV engineers or Project/Account Managers who have greater technical skills, higher access permissions, and enough time to analyse the fault in depth. They may be internal or of the vendor’s staff
· If an incident requires special expertise or access, 2nd Level engineers might need to contact experts (in-house or from the vendor or a third party). This is known as 3rd level support. In some organisations the Project/Account Managers can cover both 2nd and 3rd Level Support, based on their seniority and experience
· When the fault is solved, the Operations Center closes the ticket
Besides the data from the site, if a CCTV system is available on-site, the O&M service provider should, as a best practice, be able to access it for visual supervision and also have access to local weather information.
The O&M service provider is responsible for being the main interface between the plant Owner, the grid operator, and the regulator (if applicable) over the lifetime of the O&M contract regarding production data. The Asset Owner should be able to contact the Operations team via a hotline during daytime, when the system is expected to generate electricity. The Operations team is also responsible for coordinating accordingly with the Maintenance service provider/team.
Performance analysis and improvement
The O&M service provider ensures that the performance monitoring is done correctly.
In general, the data should be analysed at the following levels:
1. Portfolio level (group of plants) under control of the O&M service provider (minimum requirement)
2. Plant level (minimum requirement)
3. Inverter level (minimum requirement)
4. String level (as a recommendation)
The analysis should show the required data on the levels listed above and for different time aggregation periods from the actual recording interval up to monthly and quarterly levels.
The analysis should also include the option for having custom alarms based on client specific thresholds such as business plan data or real-time deviations between inverters on-site.
In particular, the agreed KPIs should be calculated and reported. Special attention should be paid to the fact that KPI calculations should take into consideration the contractual parameters between O&M service provider and Asset Owner, to provide an accurate and useful calculation for evaluation and eventually liquidated damages or bonuses.
Please see previous section 1.2.1 "Operating and maintaining the electrical systems in a PV plant" - Power Plant Maintenance and Data and Monitoring Requirements.
Operating and maintaining the security system
It is important that the solar PV power plant, or key areas of it, are protected from unauthorised access. This serves the dual purpose of protecting the plant’s equipment and keeping members of the public safe. Unauthorised access may be accidental with people wandering into the plant without realising the dangers, or it may be deliberate for the purposes of theft or vandalism.
Together with the O&M service provider and the security service provider, the Asset Owner must put in place a Security Protocol in case an intrusion is detected.
In most countries there are strict legal requirements for security service providers. Therefore, solar PV power plant security should be ensured by specialised security service providers subcontracted by the O&M service provider. The security service provider will be responsible for the proper functioning of all the security equipment including intrusion and surveillance systems. They are also responsible for processing alarms from the security system by following the Security Protocol and the use of the surveillance systems installed on site. The security system provider will be also responsible for any site patrolling or other relevant services. The security service provider should also assume liability for the security services provided. The O&M service provider will coordinate with the security service provider and may choose to act as an intermediary with the Asset Owner.
A security system may be formed of simple fencing or barriers but may also include alarm detection and alerting systems and remote closed-circuit television (CCTV) video monitoring. If solar PV power plants have CCTV systems in place, an access protocol would be required when reactive and planned works are carried out. This will ensure that authorised access is always maintained. This can be done by way of phone with passwords or security pass codes, both of which should be changed periodically.
For additional security and in high-risk areas it is advisable to have a backup communication line installed (often, the first thing that gets damaged in case of vandalism is communication with the surveillance station) as well as an infrastructure for monitoring connectivity and communication with the security system. As well as any remote monitoring, it is likely that provision for onsite attendance is required when significant events occur. Processes for liaising with local emergency services should be considered.
Within the solar plant, there may also be additional areas with restricted access, for example locations containing High Voltage equipment. When authorising access to the parks it is important that all workers and visitors are appropriately informed of the specific access and security arrangements and where they should or should not be. Warning signs and notices can form an important part of this and may be compulsory depending on local regulations.
As well as the general security of the site over the lifetime of the park, particular attention should be made to periods of construction or maintenance when usual access arrangements may be different. It is important that security is always maintained particularly when there are activities that may be of more interest to members of the public or thieves.
The Asset Owner will likely have insurance policies in place directly or indirectly and these will be dependent on certain levels of security and response being maintained. Failure to meet these may have important consequences in the case of an accident or crime.